Figure 5.1: Generating a Lognormal Distribution Using Proportionate Effect and Power Law Scaling from Proportionate Effect with a Minimum Size Threshold
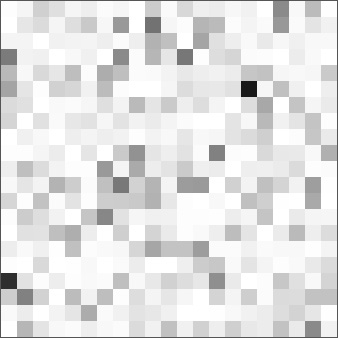
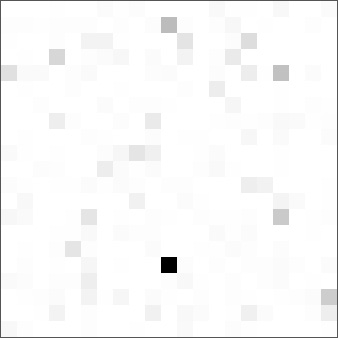

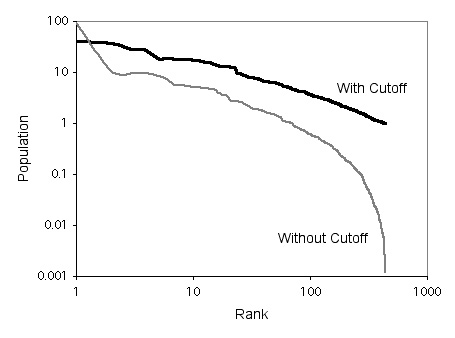
Figure 5.2: Emergence of the Rank-Size Distribution Using Proportionate Effect with Cut-Off
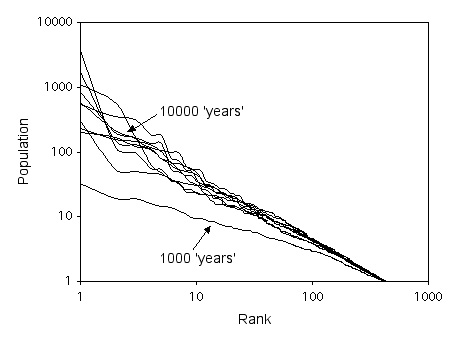
Figure 5.3: Power Law Scaling as the Population Distribution Emerges
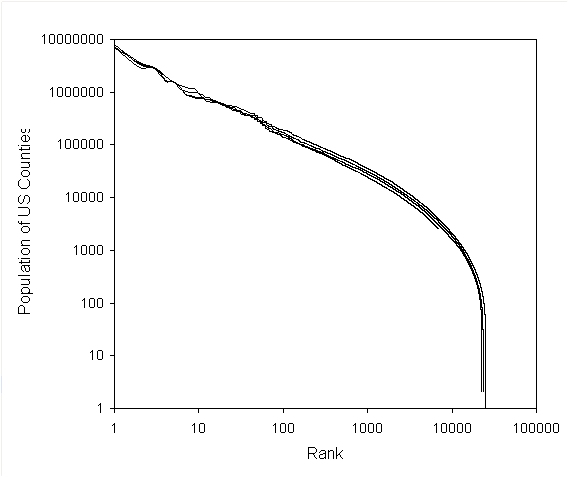
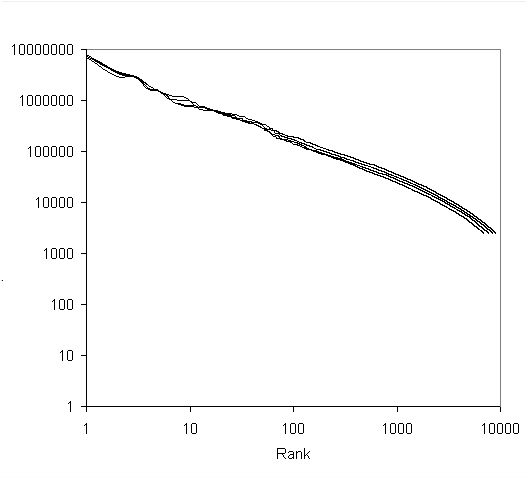 Figure 5.4: Lognormal and Power Law Scaling of the US Population Based on ‘Incorporated Places’ 1970 to 2000
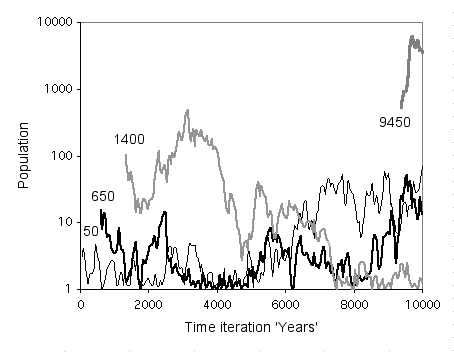
Figure 5.5: The 1st, 6th, 12th and 18th Top Ranked Population Cells and Their Progress Through the Simulation
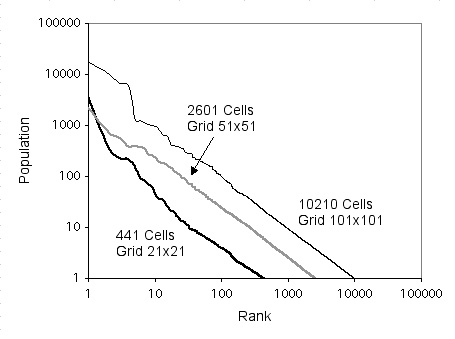
Figure 5.6: Consistent Scaling Behavior for Different Sizes of Lattice
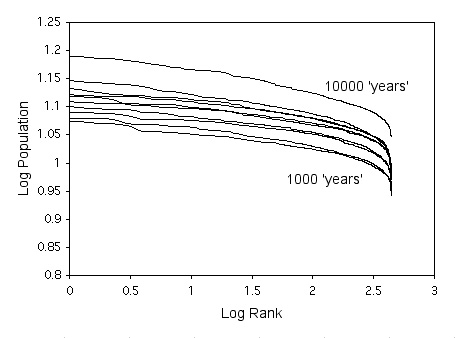
Figure 5.7: Lognormal Distributions Generated from Proportionate Effect With Diffusion
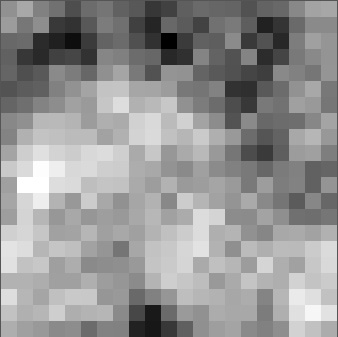
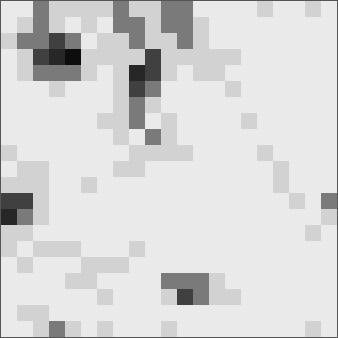 Figure 5.8: Patterns of Diffusion
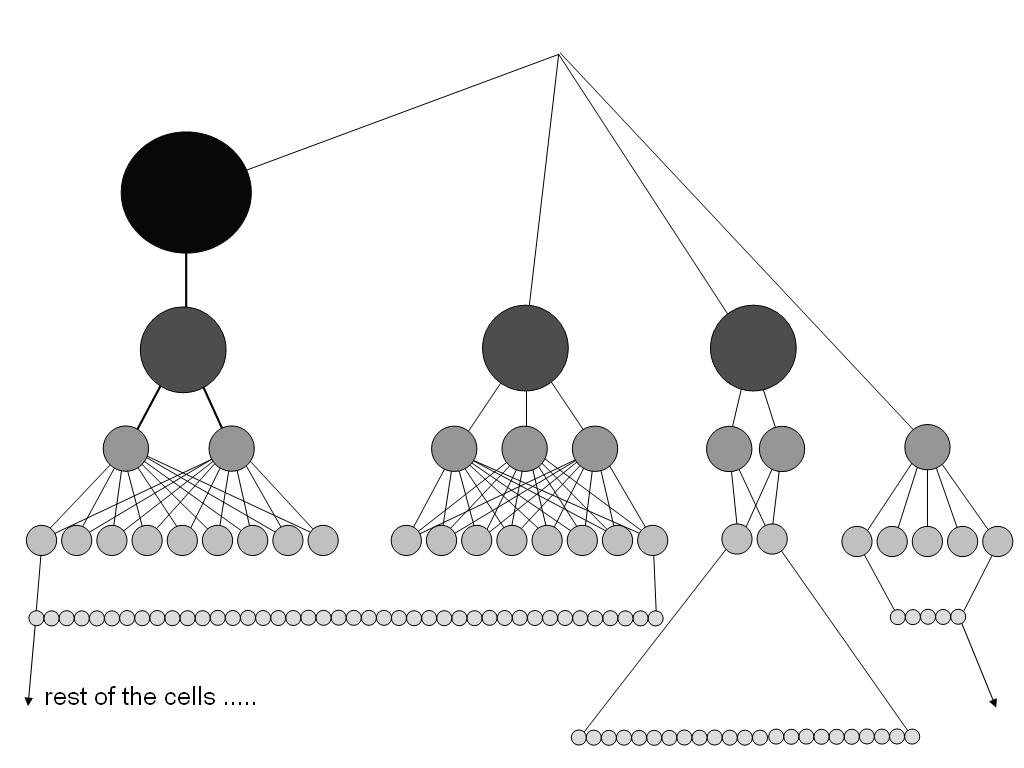 Figure 5.9: A Hierarchy for the Pattern at
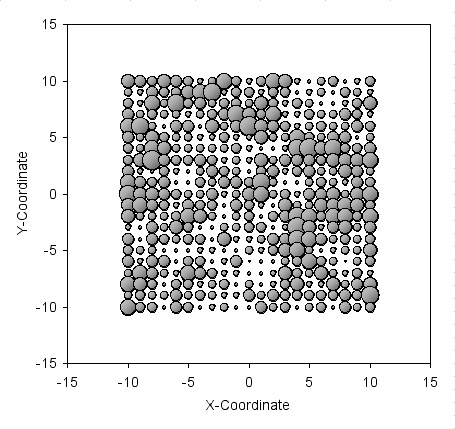
Figure 5.10: Top Ranked Cells During the 10000 ‘Year’ Simulation
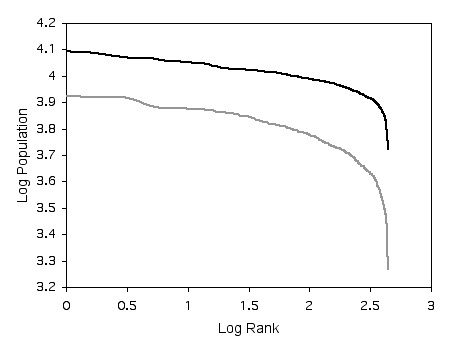
Figure 5.11: City Size Distributions for the Agglomeration Model at and
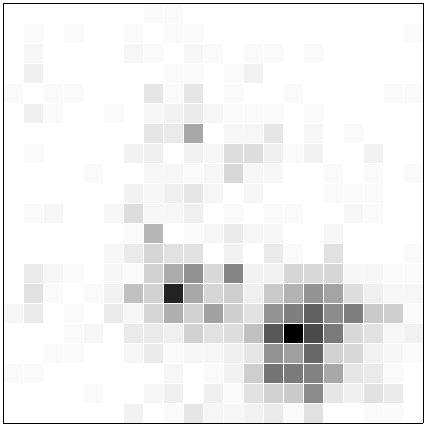
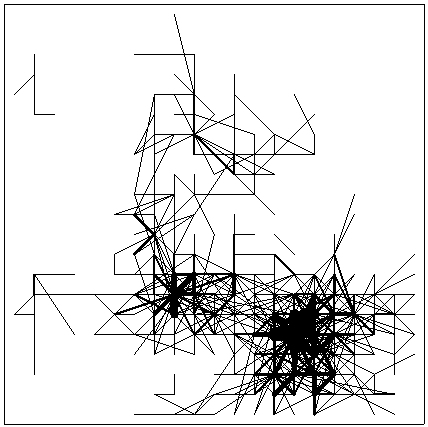

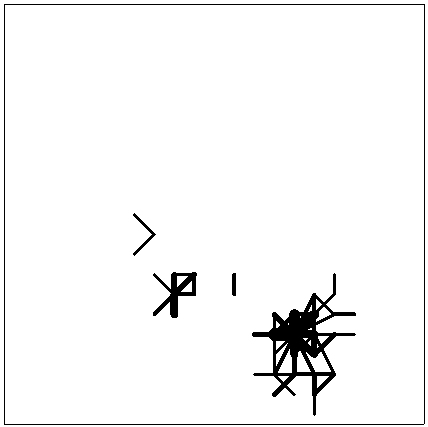 Figure 5.12: Patterns of Network Connectivity
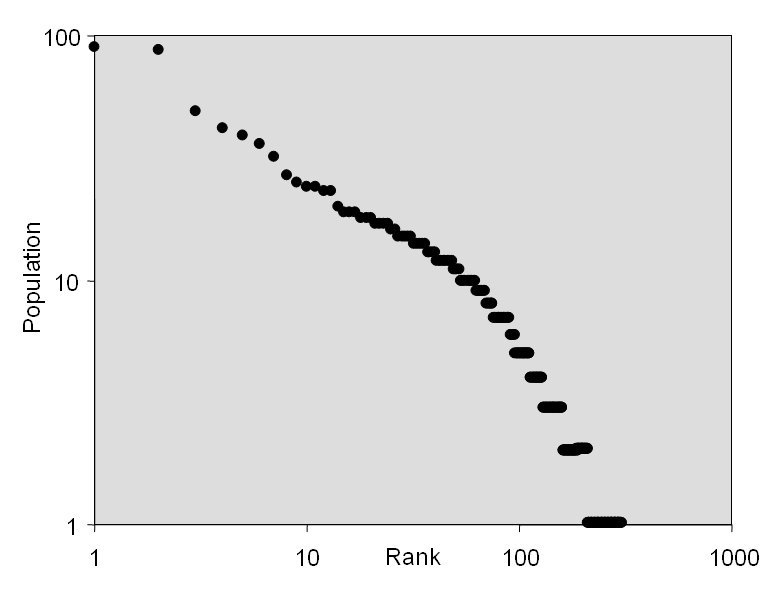 Figure 5.13: Rank Size Distribution of the Nodal Network Distribution
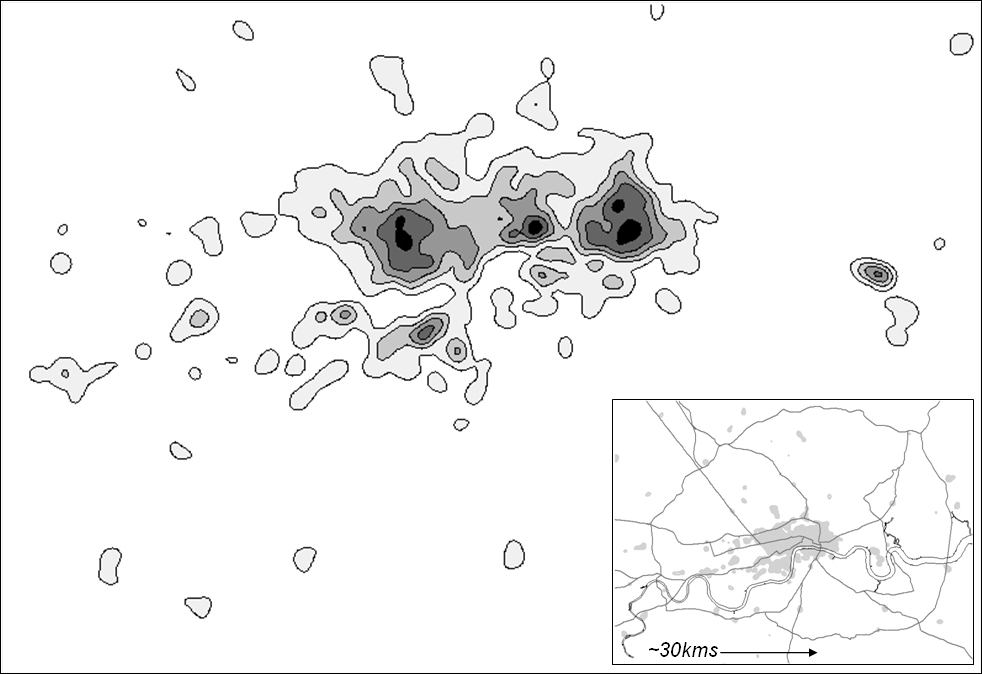 Figure 5.14: The Implicit Retail Hierarchy in Central London
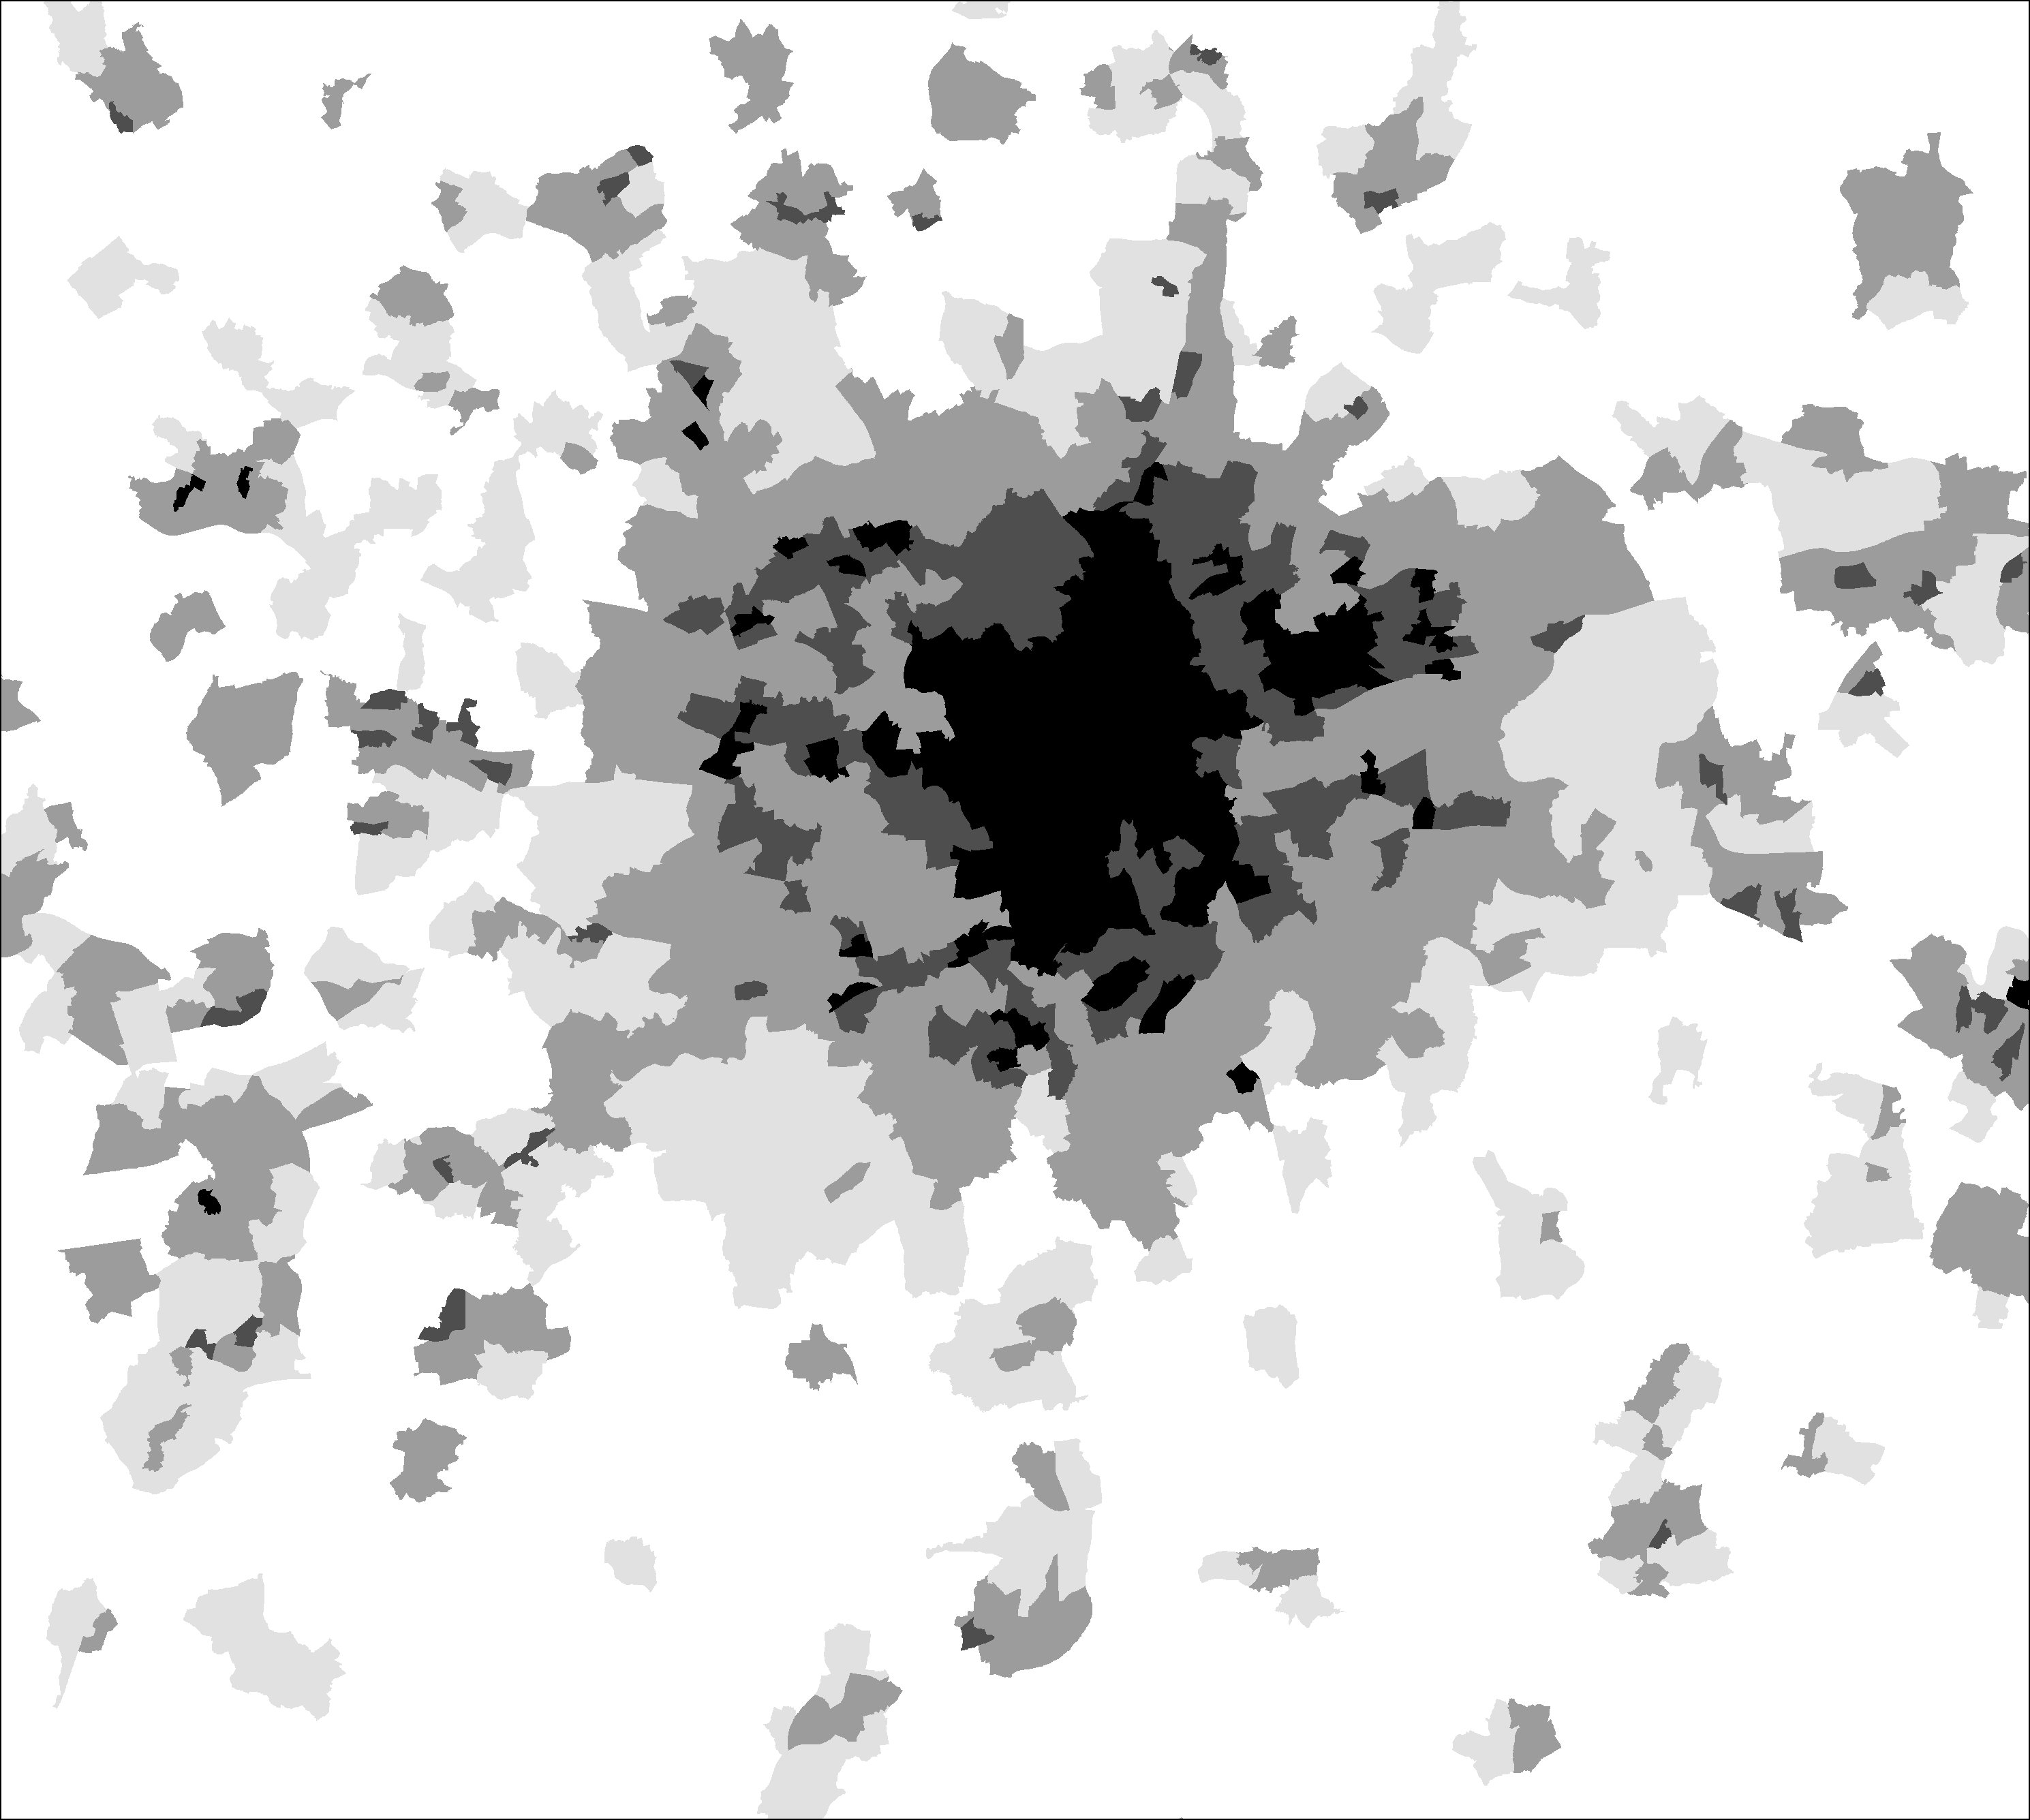
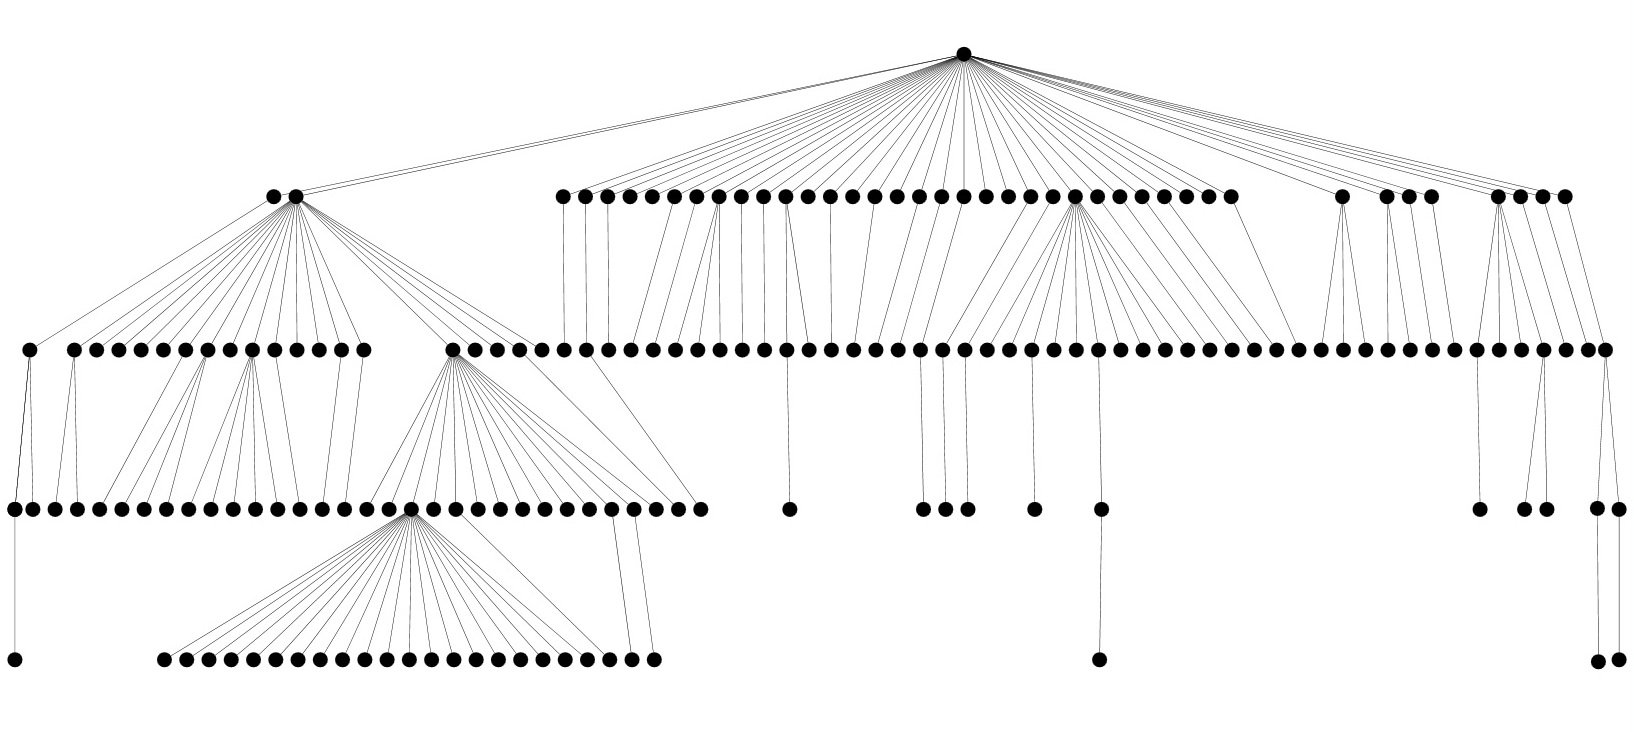 Figure 5.15: The Explicit Population Hierarchy in Greater London

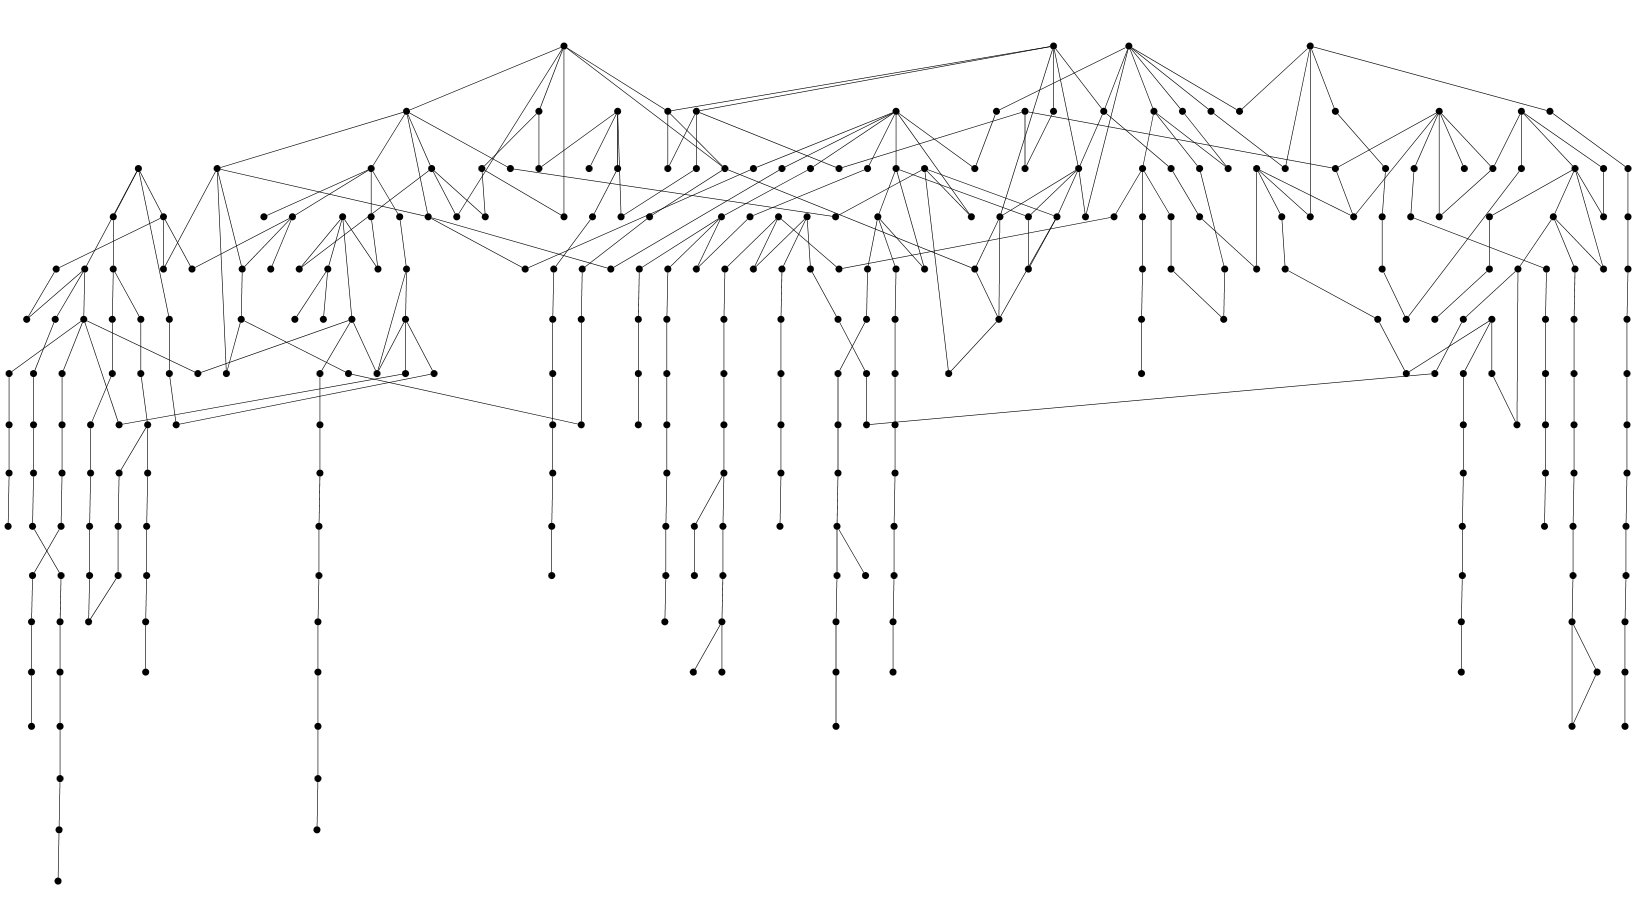 Figure 5.16: A Strict Hierarchy from a Tree-Like Graph of the London Tube System