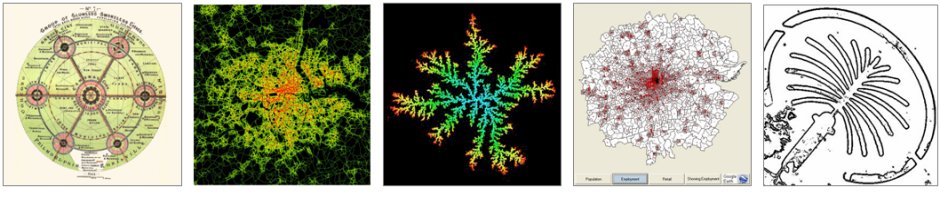
An Array of Simulations from the Early Days to Now (2011)
One of my pet projects is to discover the media that we have used in our science of cities since the time I got involved (1966) and before. Back in the 1960s, I learnt to program (in Atlas Autocode) using punched type and batch processing where one used a “Flexowriter” to punch the tape, scissors and special tape to edit our errors, and large paper outputs which were produced on sprocket line printers.
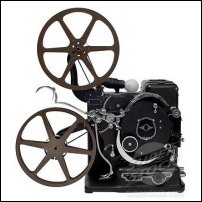
Unfortunately I do not have any photographs from those early days in Manchester – and I threw all the media away – who would ever be interested in this arcane stuff – how wrong can you be – but here are some similar pictures of this media to give you a sense of what it was all about. We programmed Lowry’s model in this way and in my book Urban Modelling (which you can download from here), the models were produced in this way. One day turnaround was usual. You had to get it right. Amazing we ever produced anything really.
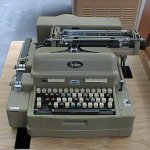

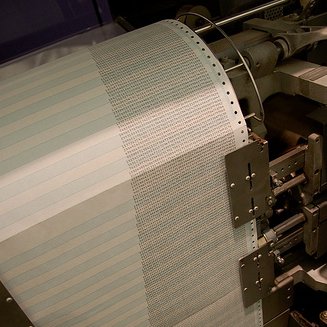
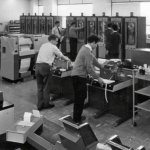 Punching code onto tape Punched tape Line Printer The Machine Room
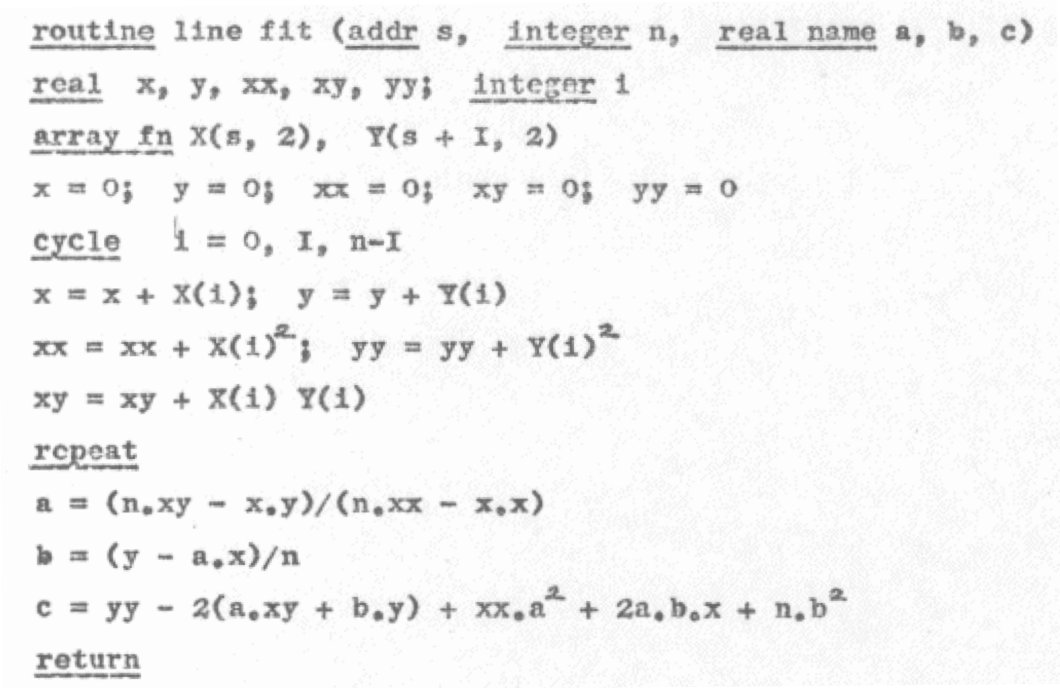
What we wrote the first models in: a fragment of Atlas Autocode, a forerunner to Algol, Pascal, …. and onwards. Click on it to see it a little larger
Computer graphics had a painful gestation and only when computer memory came to be associated with pictures as arrays of pixels did the field really take off. In the 1950s and 1960s, vector line plotters which usually operated offline from the machine, oscilloscopes based on storage tubes, and line overprinting generated symbol maps (SYMAP) were the main graphic media. The computer screen only took off in the late 1970s, early 1980s once the PC arrived with its immediate interactivity and graphical user interface. Then we began to get pictures on screens as we show for our early Melbourne model in the section on early movies.
From then on, the field exploded and we now have some very fancy ways of representing graphics – our first movies are of the operation of land use models, our second of finer scale pedestrian movement models, while our most contemporary illustrations are movies of transport flow systems.
If you click on the icons below, this will take you to the media. Or you can go there direct through the submenus.
 Early Computer Movies: 1967 to 1990
Here we show how crude movies of urban development were fashioned from SYMAP plots stitched together using crude in-betweening. And then we move onto pixel arrays on PCs and VDUs – visual display units – attached to mini and even main frame computers, which ultimately turned into work stations by the early 1990s.
 Urban Models (LUTI)
These are land use transportation interaction models that in our context evolved from early visual representations developed on workstations and then PCs. The Tyndall model and its successor ARCADIA are the key examples we show here. We have linked them to 3D media (Google Earth) loaded on the fly as these simulations proceed.
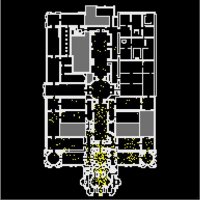 Pedestrian Movement
Down scale at the level where people move under their own steam, so to speak, we are building movement models for evacuation of dense spaces, for assessing crowding problems, and for associating how shoppers patronise retail outlets in shopping centres. Lots of challenges here as these are agent-based models.
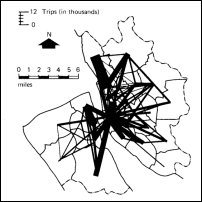
 Urban Flow Networks
Animating flows of a diurnal nature over the 24 hour day is becoming ever easier as we generate large quantities of online data based on recoding and sensing movement. We show two examples so far: flows of publicly available transport from timetables for pubic transport, and flows extracted from online ticketing systems.