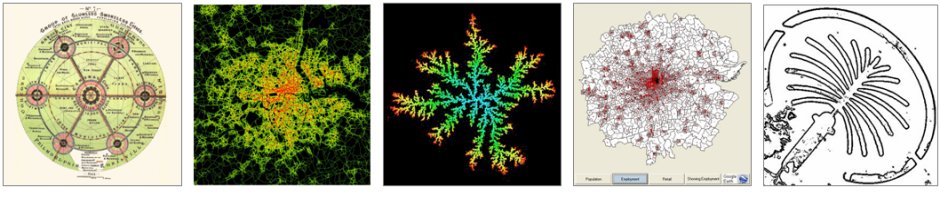
Early Animations of Urban Models
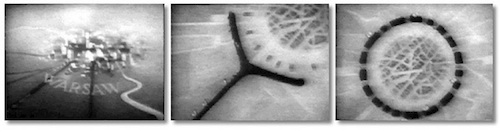 The earliest animation we know of is by the Walt Disney Company. In 194o, the company produced a 30-second B & W newsreel ” … depicting the invasion of Warsaw by the Nazis in 1939 and is remarkable as much for its artistic quality as for its rhetorical value”. Produced in the time honoured way of making paper frames and in-betweening, here aresome shots of what was done (above).
Our early computer movies of urban models are ad hoc to say the least. They begin in 1967 with Allan Schmidt’s growth of East Lansing, MI which is produced from frames printed using ‘symbol or synagraphic mapping’ (SYMAP) developed first at Northwestern, then at the Harvard Computer Graphics Lab by Howard Fisher. Jack Dangermond talks about this at the ESRI Users conference in 2004 where Allan was honoured with a lifetime award for achievement.
 In fact, almost ten years before at the Chicago Area Transportation Study (CATS), in about 1959, a cathode ray tube was used to display traffic flows or desire lines as they were called then. Best we show this first and it is to the left. After Allan Schmidt’s work, Waldo Tobler made a movie of his Detroit model but although the paper he wrote is iconic and called A Computer Movie Simulating Urban Growth in the Detroit Region , he never kept the movie itself. I have asked him a couple of times and he refers me to Hal Moellering but Hal doesn’t have a copy either. Waldo apparently was the first to develop a package for computer cartography in 1959.
I began making computer animations of LUTI models in 1981-2, and made the first movie of our Melbourne model in 1982 with a video recorder attached to a GIGI raster terminal which in turn was the I-O device to a Vax 11/780. This produces a superbly blurred movie which I have managed to retrieve and get converted. I then developed an interactive model of the same data using Waterloo Fortran for the PC which had graphics capability when I was in Hong Kong in 1986 and this program still runs on a PC. Until Vista. Unfortunately I can’t capture the screen as the graphics use a different area of the memory buffer and throw any capture program. I show what we can do from a PC but I have also made the source files available that you can download here but don’t forget these are for a PC and I haven’t tested them on recent versions of Windows. In the interests of history, you will have to bear with the Heath Robinson nature of the task.
This Melbourne model was then ported to a Sun Workstation when I was in Buffalo in 1991 and here is a graphic of the text and a paper which you can read. From then on visual interfaces became common, and we enter the modern age. Below I show two examples from our current LUTI models – the Tyndall model and ARCADIA. Here is all the media. Enjoy. I did and I am trying to retrieve more.
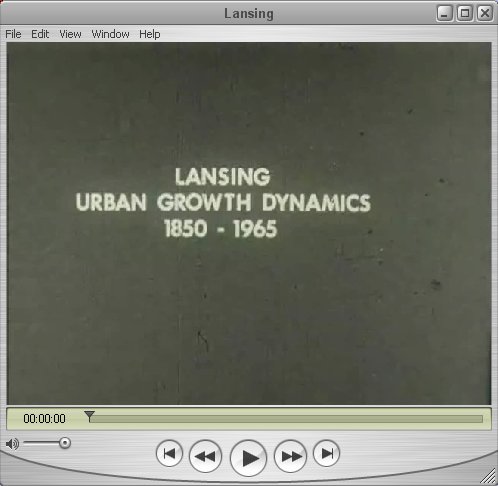
East Lansing: Allan Schmidt 1967-8 (20MB)
Two YouTubeMovies: A History of SYMAP: and Allan Schmidt 2004: lots of people are mentioned in this movie – which is an oblique take on the quantitative revolution in geography as much as on the development of computer graphics for city planning.

Melbourne 1982: Mike Batty (4MB) – blurred and tiny from a VAX 11/780 on a GIGI terminal – it is a Quick Time Movie of a Quick Time Movie – just click once to play. It has the play pause bar displayed in movie form so dont try clicking this and there are some empty frames for about 3-4 seconds before it begins to play. Don’t close it as it isn’t stalled.
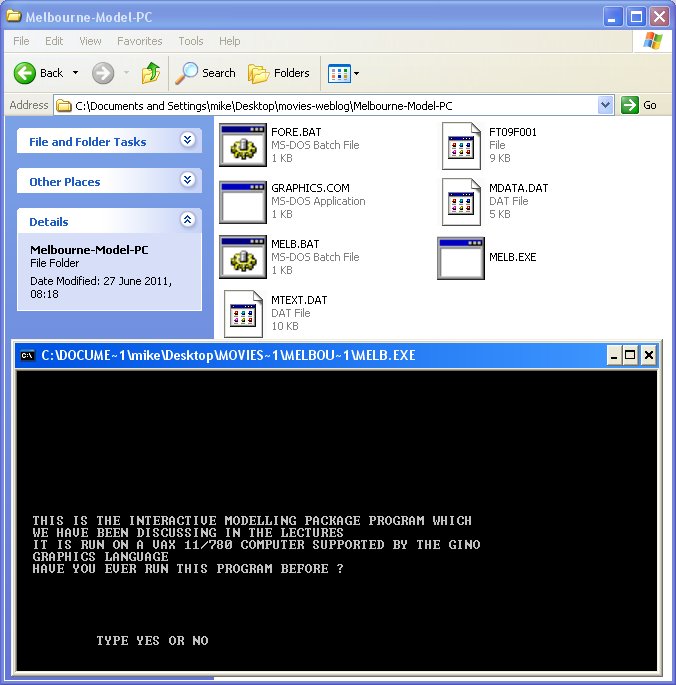
Melbourne 1986: Mike Batty (4MB) The screen at left down is the DOS screen which you can see loading in the movie. You can also download the executable WATFOR Version. Click to download the Zip File for the PC executable files. You should simply click on the executable MELB.EXRE once you have it in the folder on the desktop and unzipped. Then it will load.
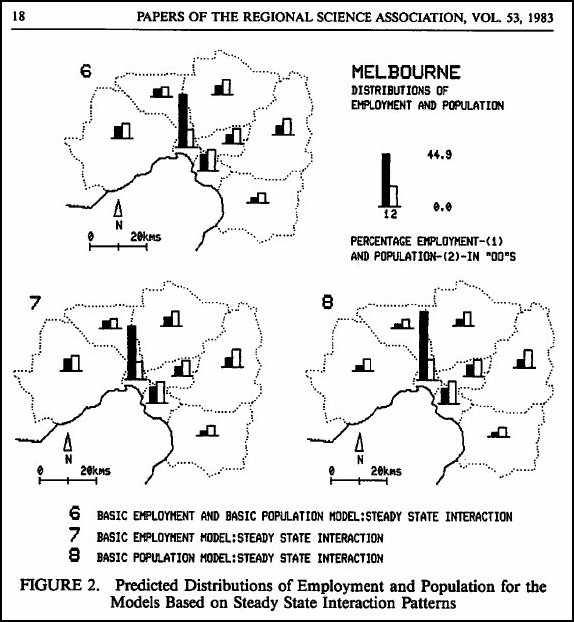
Melbourne graphics – hard copy 1982 from the Vax 11/780 reproduced in the 1983 Papers of the Regional Science Association: Get the paper as a PDF from the Articles Section of this Web Site:Click Here. Actually for a screen dump, these graphics are rather good considering that they were produced 29 years ago. The model was ported to a Sun in 1990-1 and there is an article on this too. Click Here for the PDF. Its a bit large 5MB but it is 8MB on the E&PB web site.
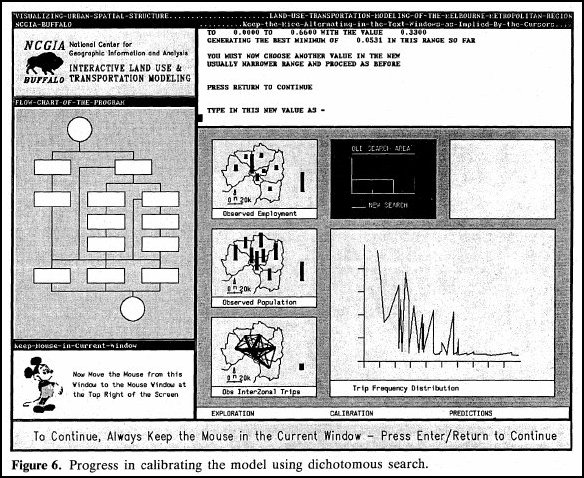
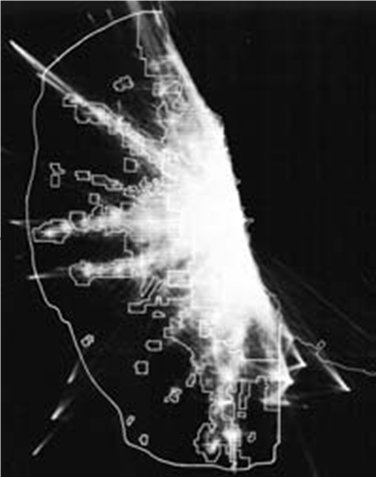
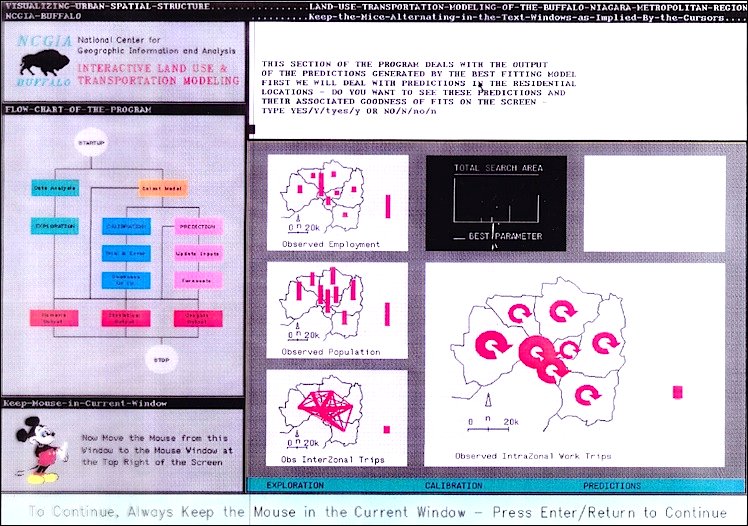
1991 from a Sun Workstation: at SUNY-Buffalo where I ran the model for a bit when I joined the NCGIA in 1990-1, I learnt some UNIX – ugh ! but didn’t see why the model should be run in C so I used some archaic version of Fortran for UNIX which produced what you see on the left. I was not liked for doing this – very non-PC – and the same is true of the LUTI models that follow if you click on the Urban Models submenu under movies. Here it is with some different media in full colour. Basically I had to scan this from a colour transparency – viewgraph – I made at the time and I retrieved it in the last week (August 15th 2011) from the UCL store. I rare example of me saving something that pertained to these old graphics, most of which have long gone.
A better view of this is in my 1994 magazine article ” Using GIS for Visual Simulation Modeling, GIS World, 7, (10), 46-48 which you can get by clicking here or on the image.