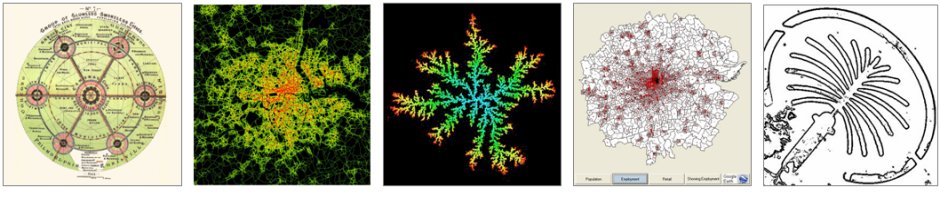
Simulations At A Finer Scale
As we go downscale to deal with streets and buildings, the focus of our simulations change. The models are essentially dynamic, agent-based and are constructed on cells or lattices. They tend to be smaller and more compact than LUTI models and they are often generated using standard software such as ABM packages like NetLogo and Repast.
Our first foray into these styles of model was 10 years ago when we began to build pedestrian movement models. In fact our first model was custom built using Swarm so we could simulate movement in Wolverhampton town centre but along side this model, we built a Starlogo version that show how shoppers leave the entry points in the town centre and ‘swarm to shop, climbing a retail activity surface so that they can visit the most attractive places.
In essence all our early models are built around the idea of an attraction surface that agents react to by seeking the greatest points of attraction but in the context of random decision-making. The agents do not only react with these surfaces but also with each other so local congestion and obstacle avoidance are programmed in. Here are some examples of simple pedestrian movement in a straight street where the walkers move from left to right in search of a point of attraction which is towards the right end of the street. We then introduce an obstacle – a doorway or gateway which congests the flow. We then show a street junction (actually in Notting Hill London) where two sorts of walkers or agents are involved. Those walking in the street and those clustering around (red watching) and then they break through into the walkers (panic). Below we show our model of shoppers in Wolverhampton town centre. Click on each of these images to load the Quick Time movie which shows you what happens.
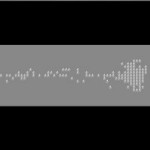
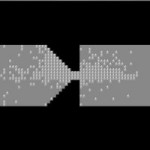
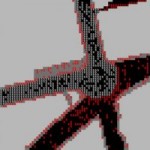
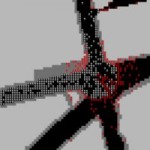
Walkers to a Light Source Confronting an Obstacle Watchers (r) Walkers (b) Watchers Break Through
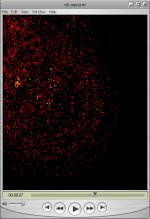
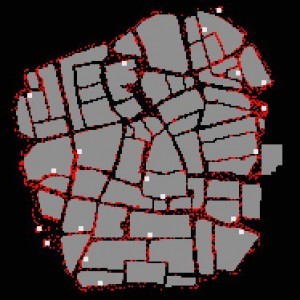 If you click on the map of Wolverhampton town centre left (about 1 square km in area), a movie will launch that shows you how shoppers leave the entry points (white squares) and then move through the streets (avoiding buildings and each other) towards the highest point of the retail attraction surface. This is circular shaped surface which peaks in the market square which is in the north central part of the map. All the shoppers do not ultimately reach this high point because along the way they encounter retail opportunities that satisfy their needs.
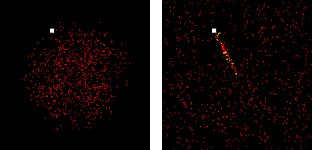
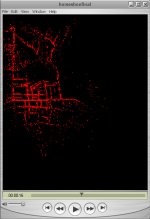
Our more extensive model involved movement and congestion in a district called Notting Hill in west central London where a 2 day Carnival attracting up to 1 million visitors is held each year in late August. This consists of a continuous parade and many celebrations of West Indian music and culture. The problem was to reroute the Carnival to avoid congestion and to maximize security and safety. Our model essentially first produced shortest routes from the subway stations and other entry points to attractions (events, parade etc.) in the area using the Swarm algorithm and then used the surface of shortest routes to direct walks to the key attractions. This algorithm assumes walkers move randomly from some source and when they encounter a sink – i.e. a place where they wish to visit, they note it and then return using the most direct route back to the place where they came from – the source. In doing so they lay a trail – a scent – like ants and others who have not found the sink, ‘smell’ this route and with some probability, then follow the scented trail which is the shortest path. This process gets reinforced as more and more walkers encounter the trail and in this way we build up a shortest path surface that you can see in the movies below. Here is a picture of a simple model with one source and one sink , one origin and one destination. Click to play below. Note that when walkers are swarming randomly or moving to the destination they coloured red and once they encounter the destination and return they turn yellow. You can then see the shortest path being reinforced.
First we show some movies about how pedestrians cluster and avoid each other. Then we show various movies from the model. First we show the routes – the existing (complete) O shaped route, then proposed U and L shaped routes, the Second the simulations which you can load by clicking on the QT icons.
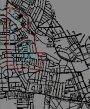 Existing O shaped route in red
 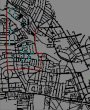 U route
 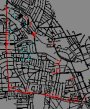 L route
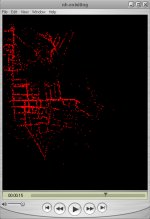
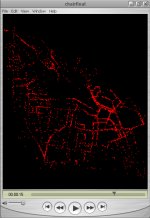 Swarm for Shortest Routes Existing Simulation Simulation of U Shaped Route Simulation of L Shaped Route
To get a real appreciation of what is going on here, you need to read something on this and the chapter on pedestrian modelling in the CASA book of GIS is as good as any.BATTY-Ped-Chap-2003