
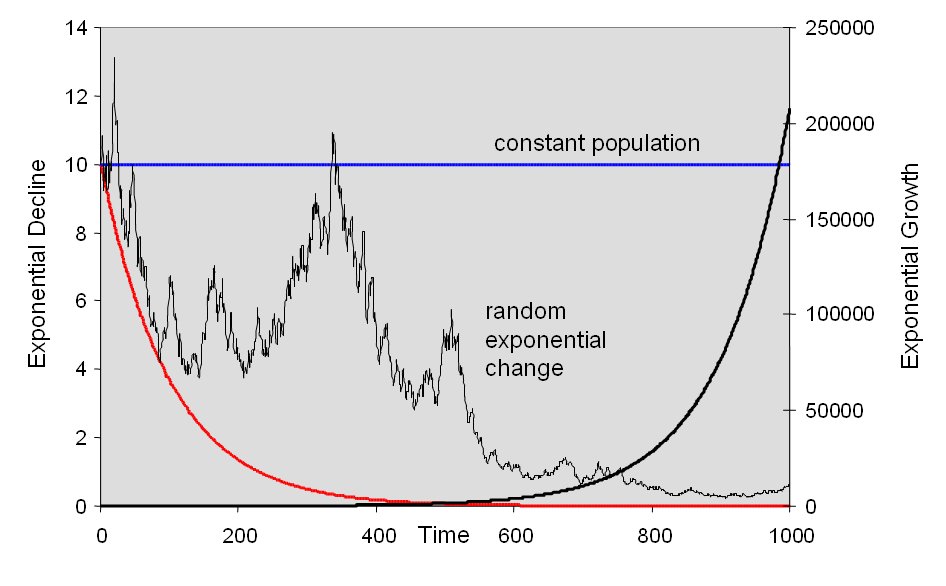
 Figure 4.1: Exponential Change
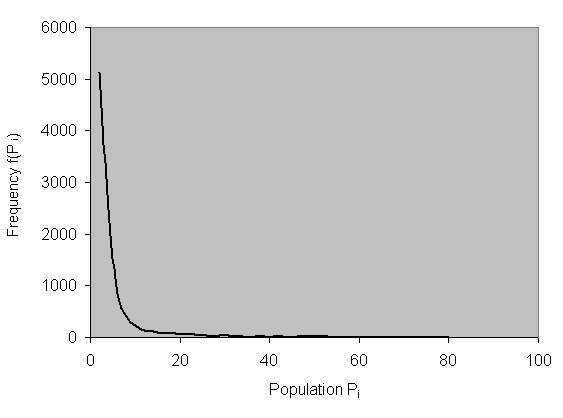
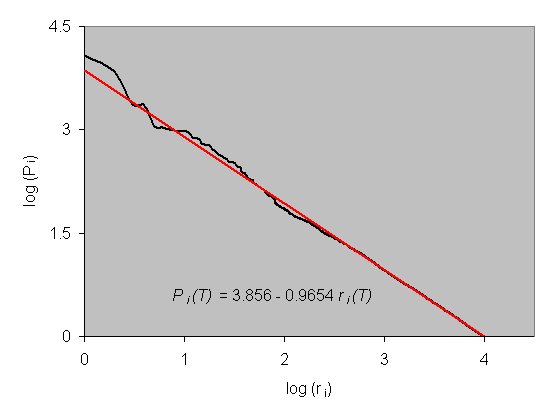 Figure 4.2: Proportionate Growth
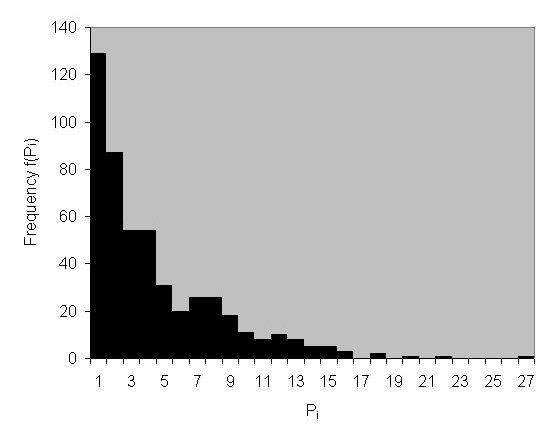
 Figure 4.3: The Additive Exchange Model Generating the Boltzmann-Gibbs Distribution
Figure 4.4: A Multiplicative Exchange Model Generating a Power Law-Like Distribution
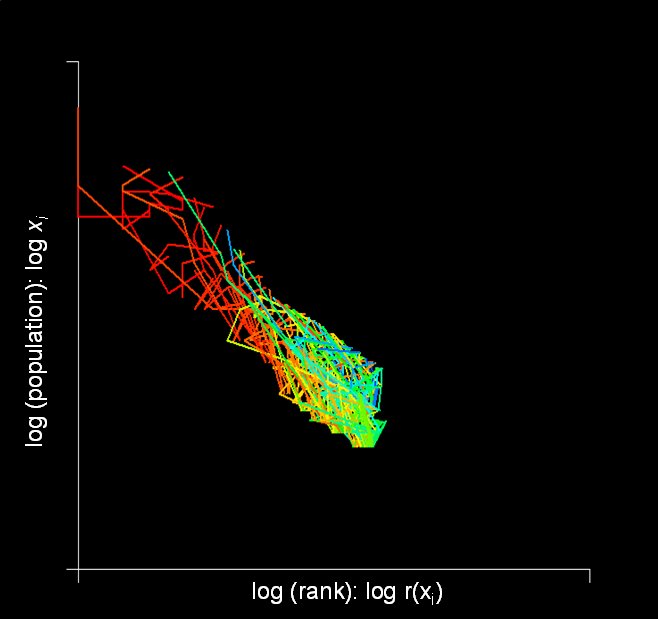
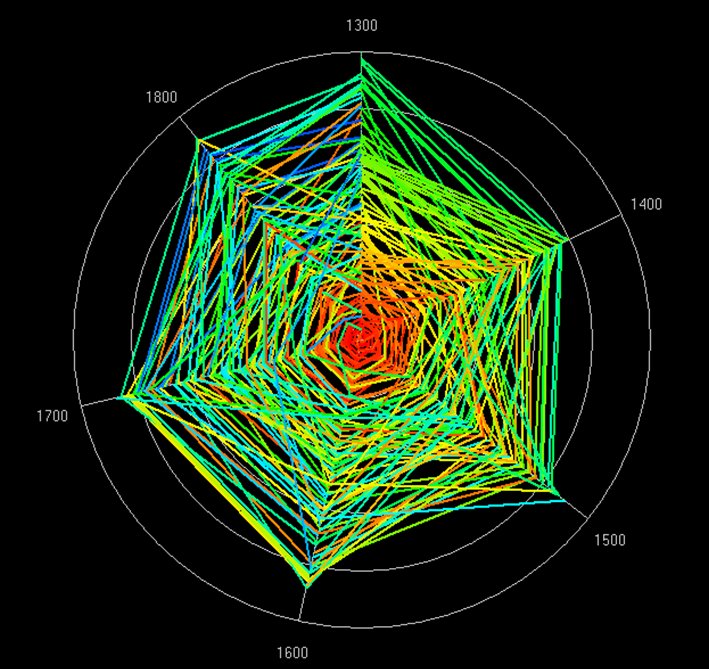 Figure 4.5: Visualizing Space-Time Dynamics in Terms of Rank Shift
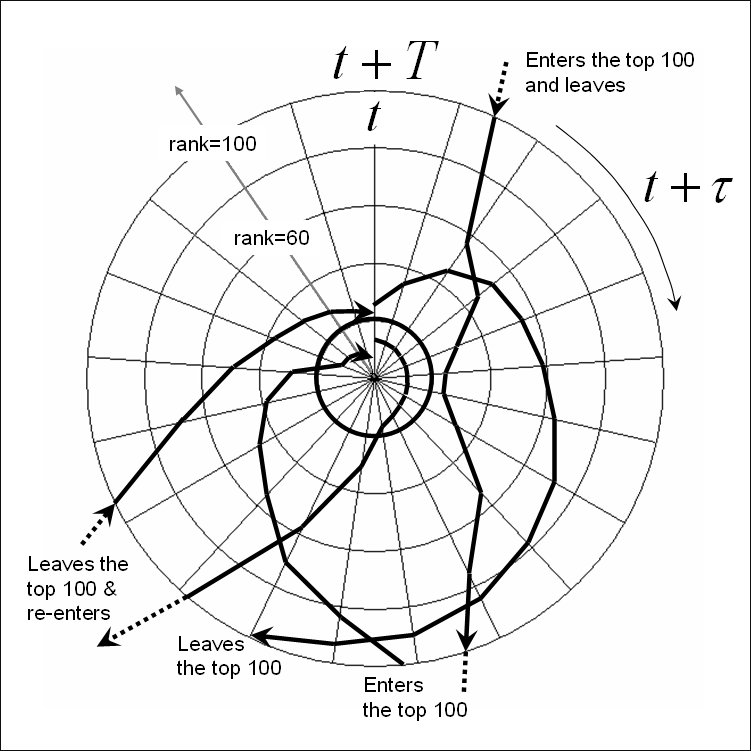
Figure 4.6: Possible Trajectories Defining the Morphology of the Rank Clock
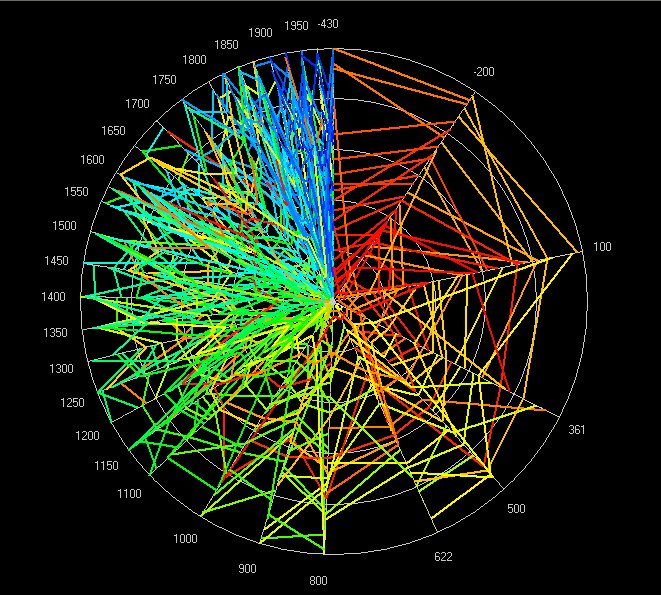
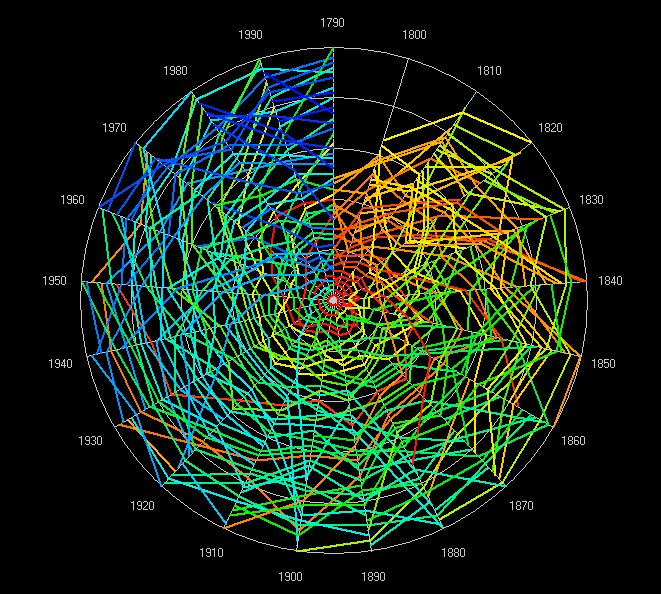
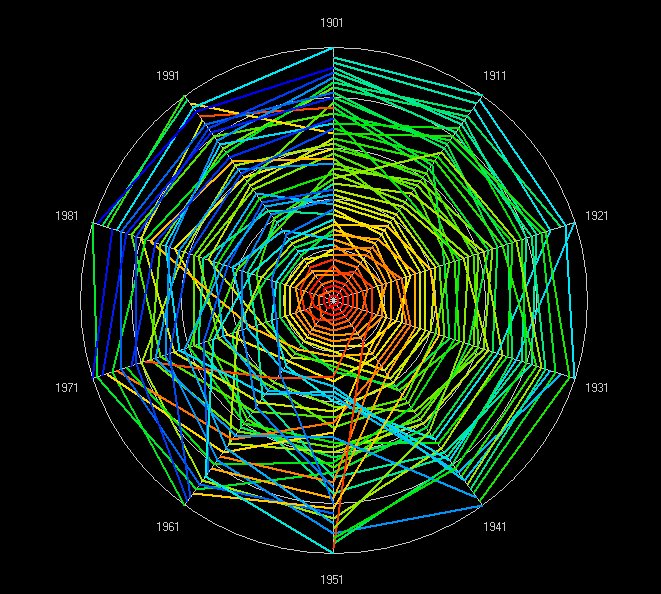
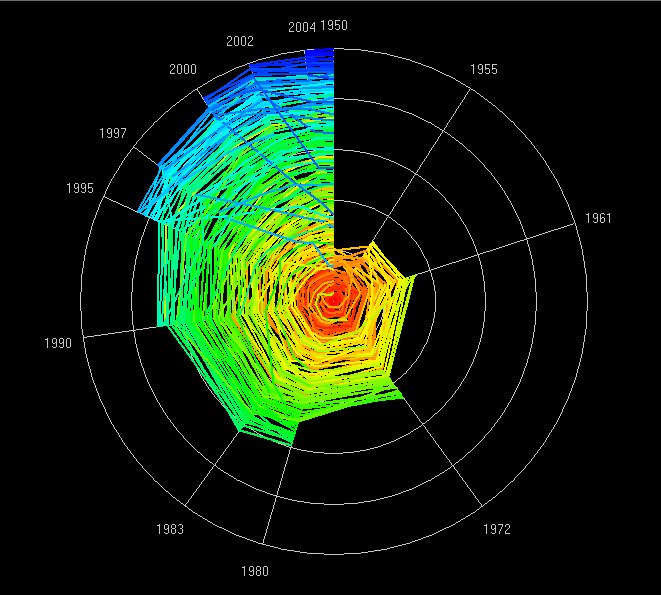 Figure 4.7: Rank Clocks for (a) the World, (b) the US, (c) Great Britain, and (d) Israel
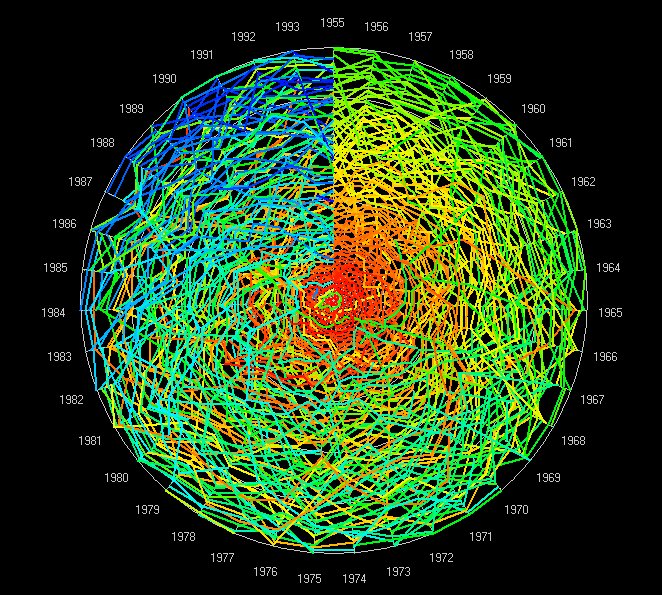
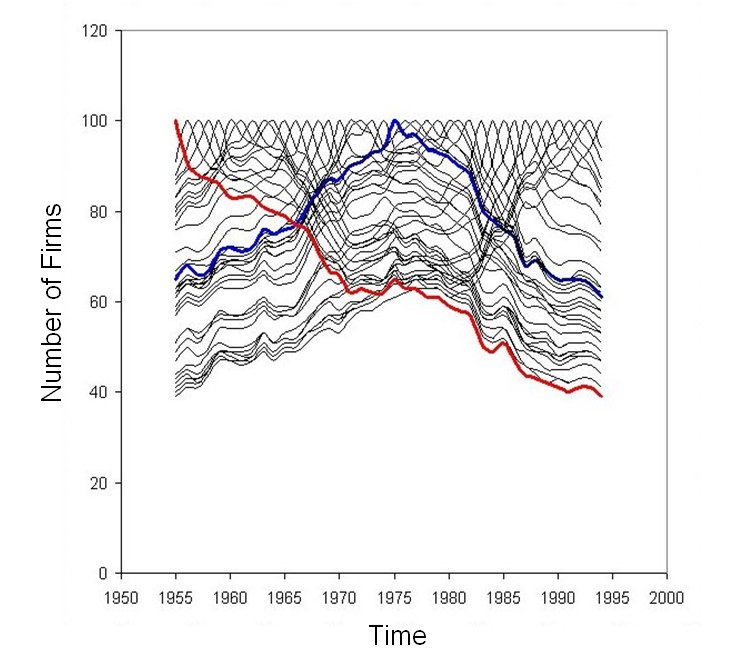 Figure 4.8: (a) The Fortune 100 Rank Clock and (b) the Persistence-Decline of Firms by Rank 1955-1994
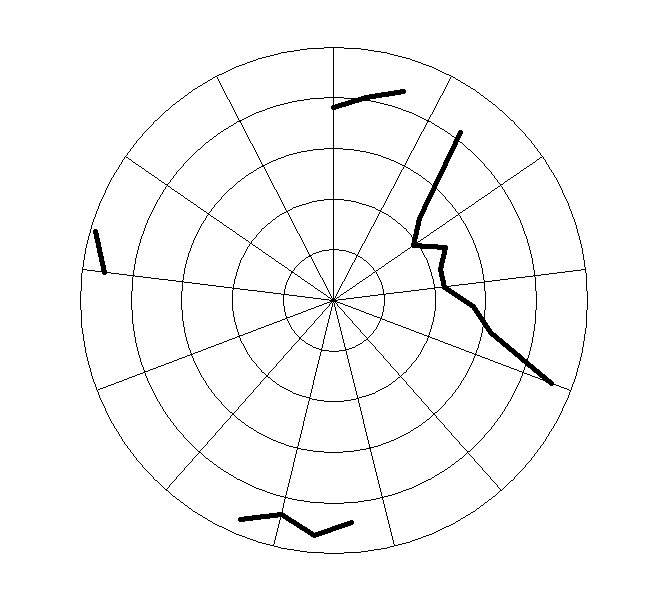
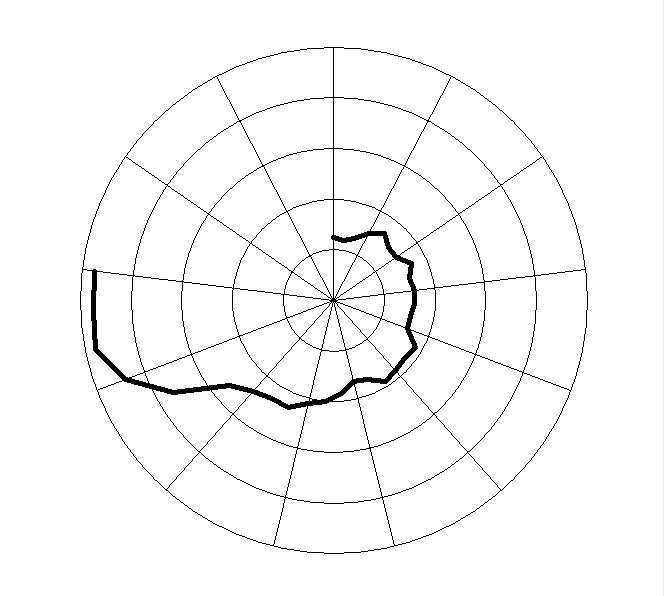
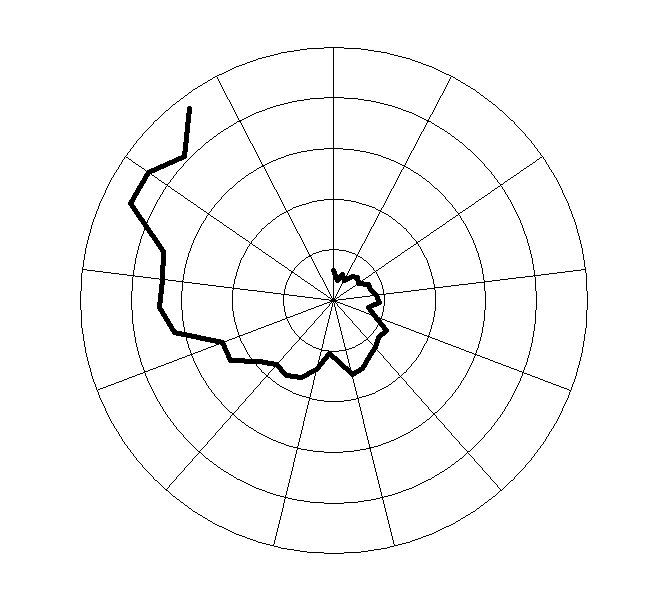
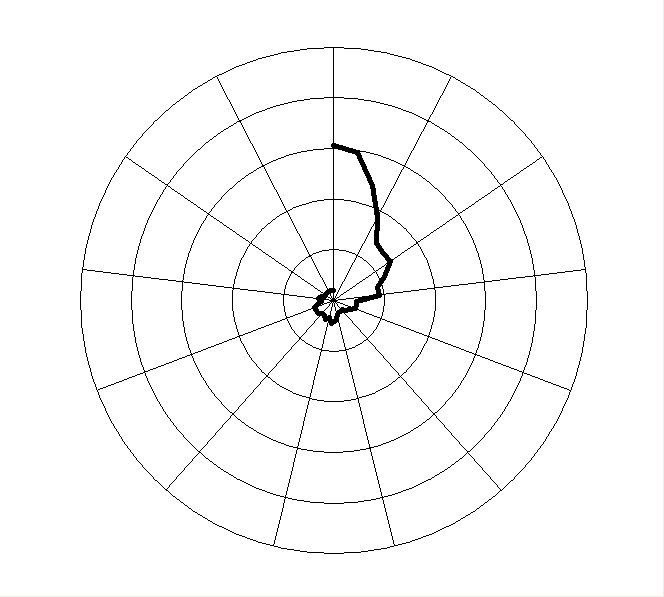
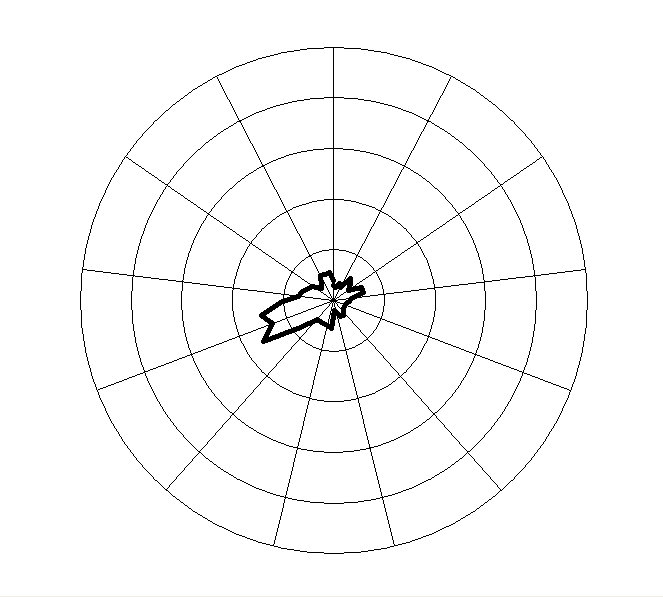
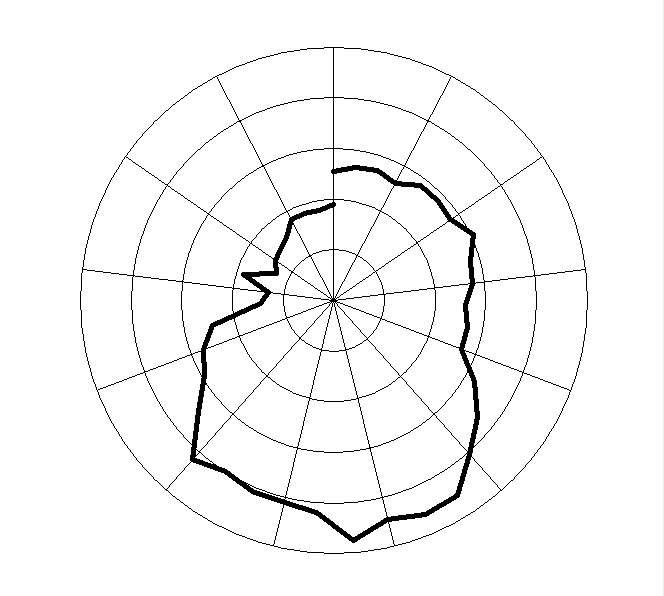 Figure 4.9: Individual Rank Trajectories for Selected Fortune 500 Firms 1955-1994
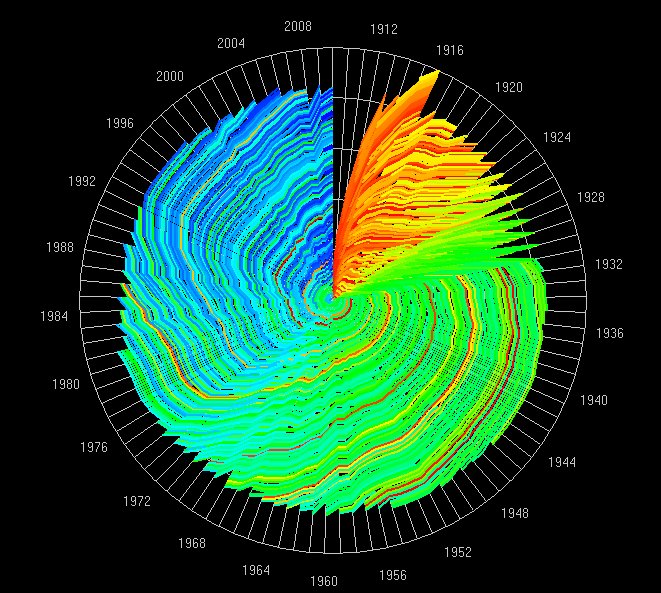
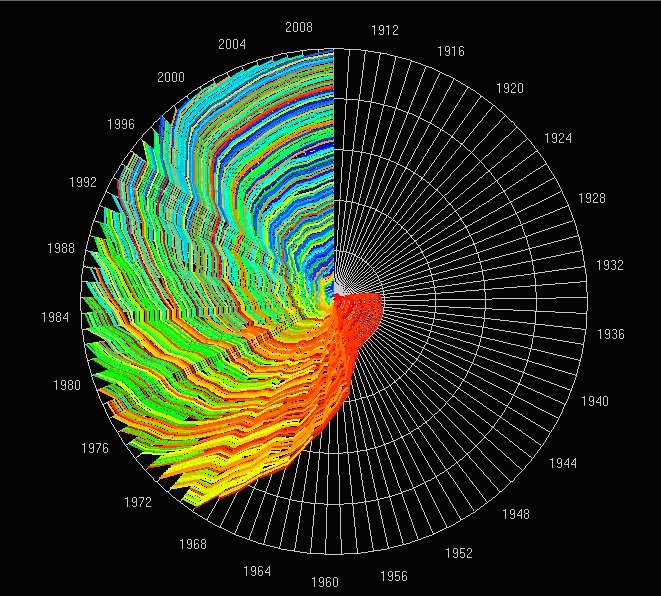 Figure 4.10: Rank Clocks of the Top 100 High Buildings in the New York City (a) and the World (b) from 1909 until 2010