
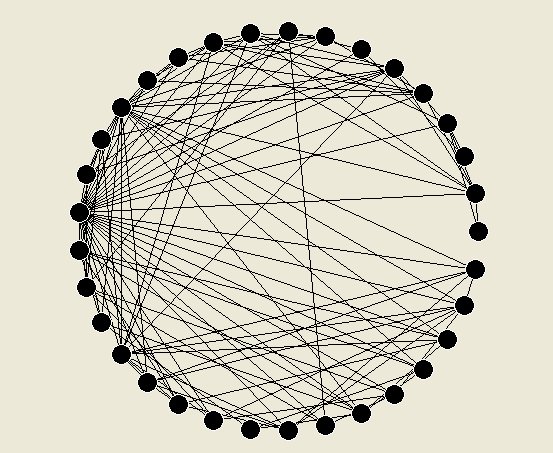
 Figure 3.1: Flows, Connectivity, and Networks at Different Flow Thresholds
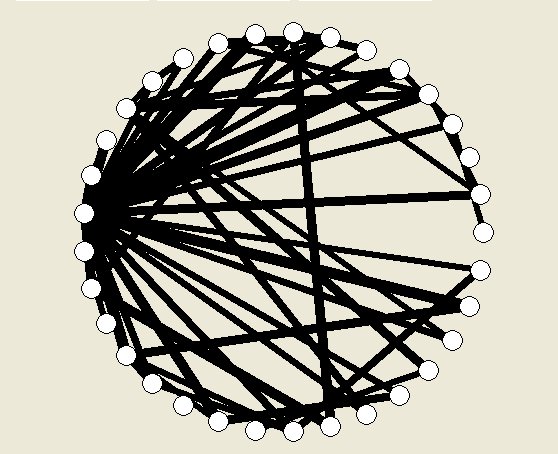
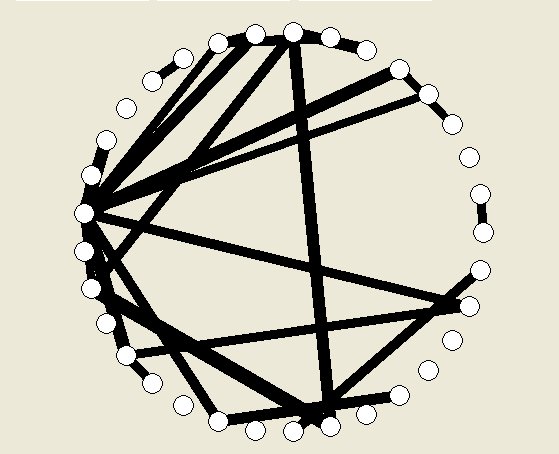
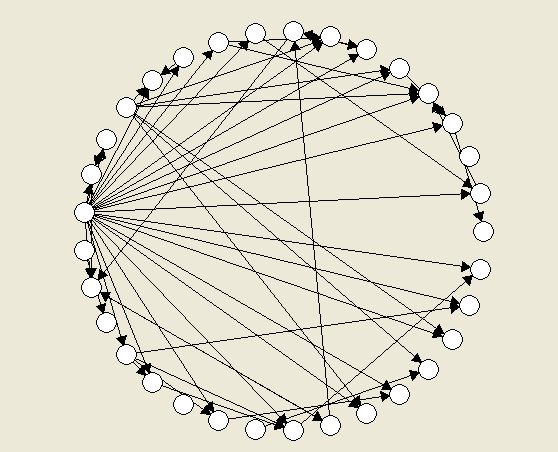 Figure 3.2: Directed Flows and Graphs Illustrating a Weakly Connected System
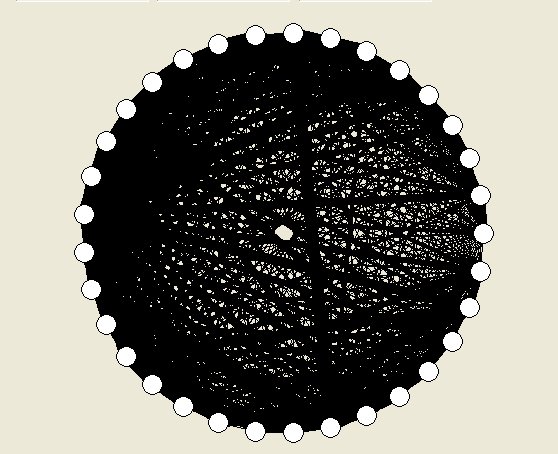
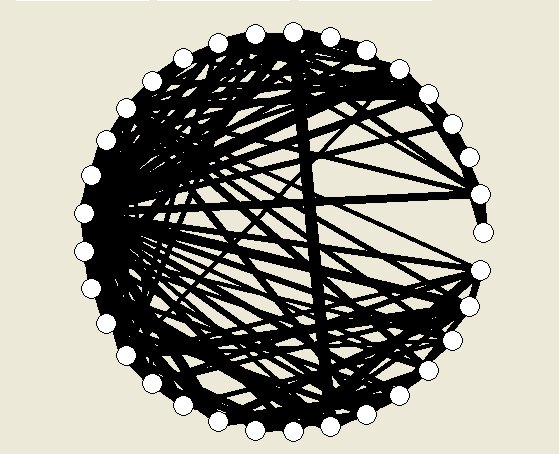
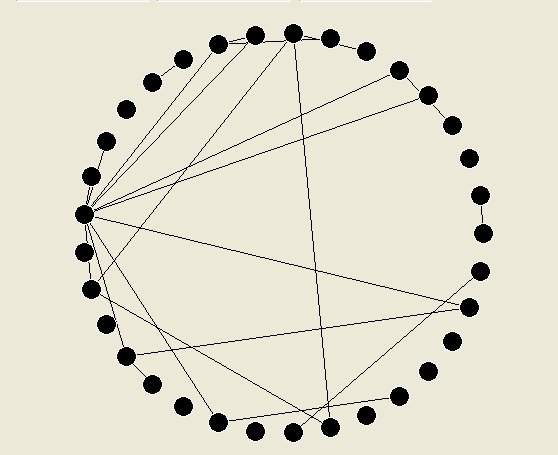
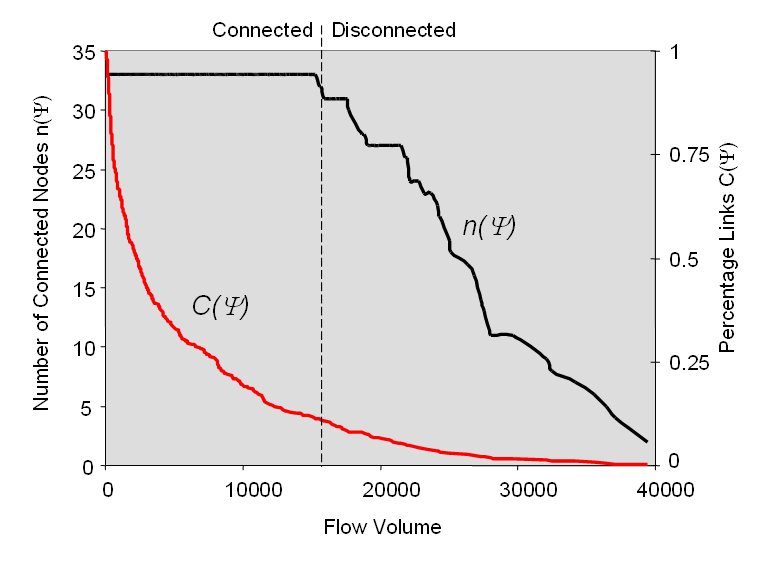 Figure 3.3: The Transition from Complete Connection to Disconnection
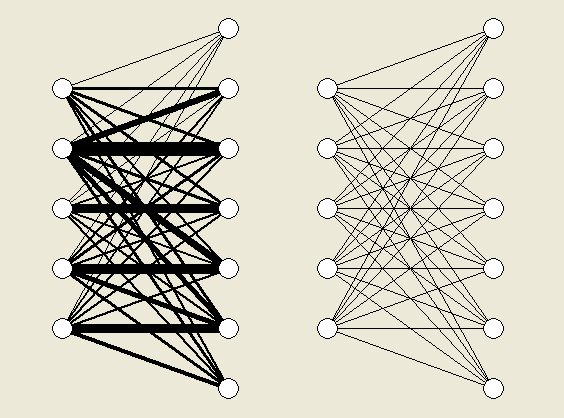
Figure 3.4: The Bipartite Flow Graph and Its Binary Equivalent
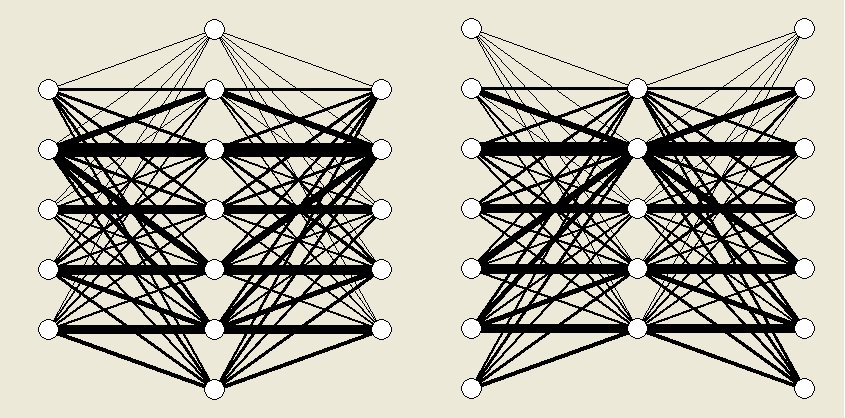
Figure 3.5: Joining Bipartite Graphs (a) Through Destinations and (b) Through Origins
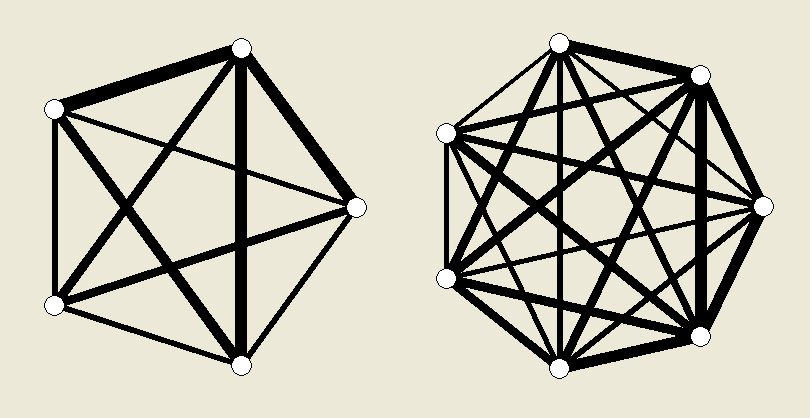 Figure 3.6: The Correlation Flow Graph Based on Origins and its Dual Based on Destinations
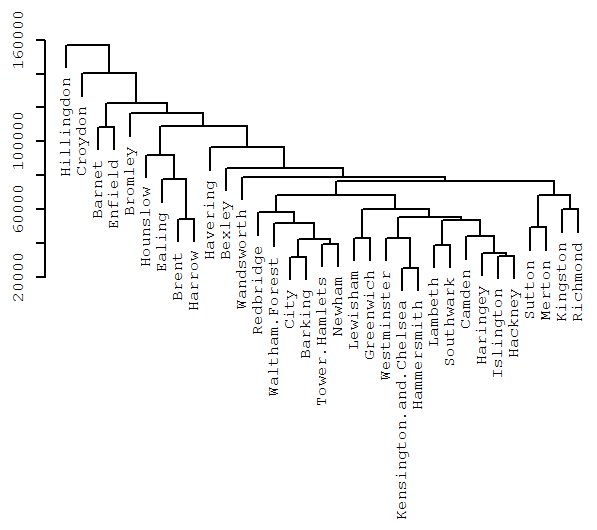
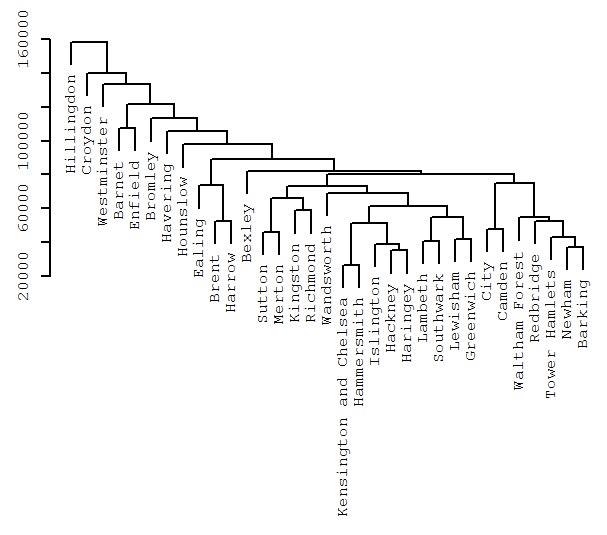 Figure 3.7: Hierarchical Clustering of Differences Between (a) Origins Based on Destination Flows and (b) Destinations Based on Origin Flows
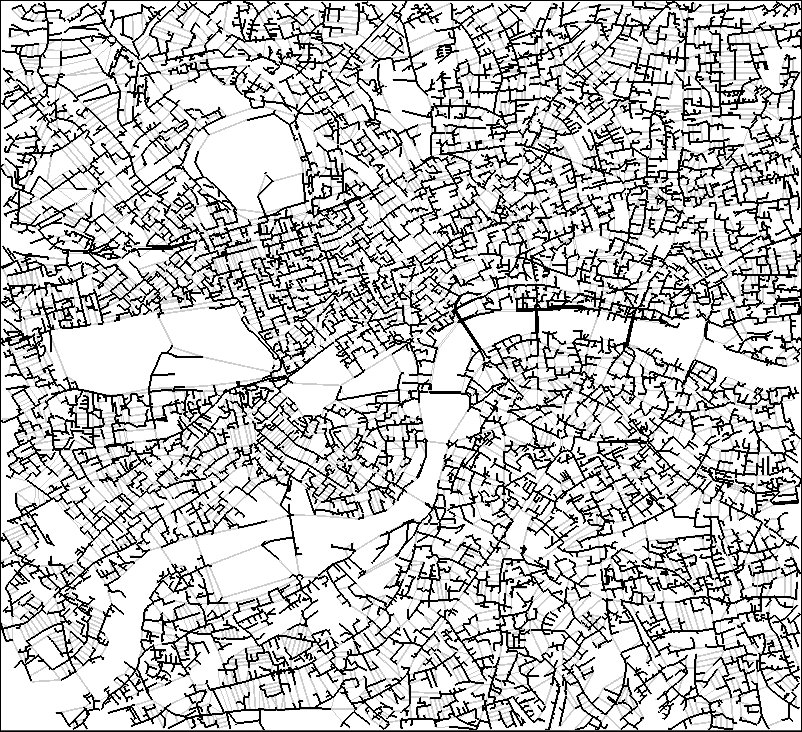 Figure 3.8: A Planar Graph of Streets in Central London
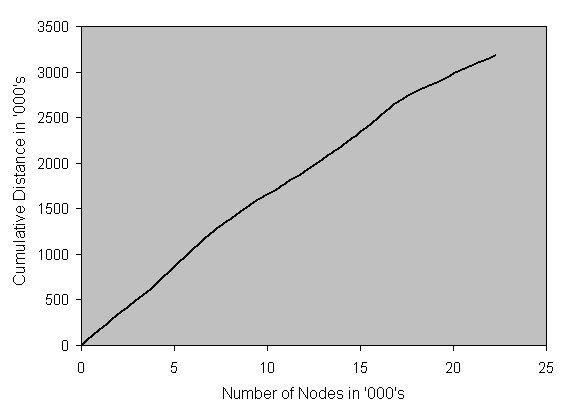 Figure 3.9: Cumulative Distance in the Planar Graph
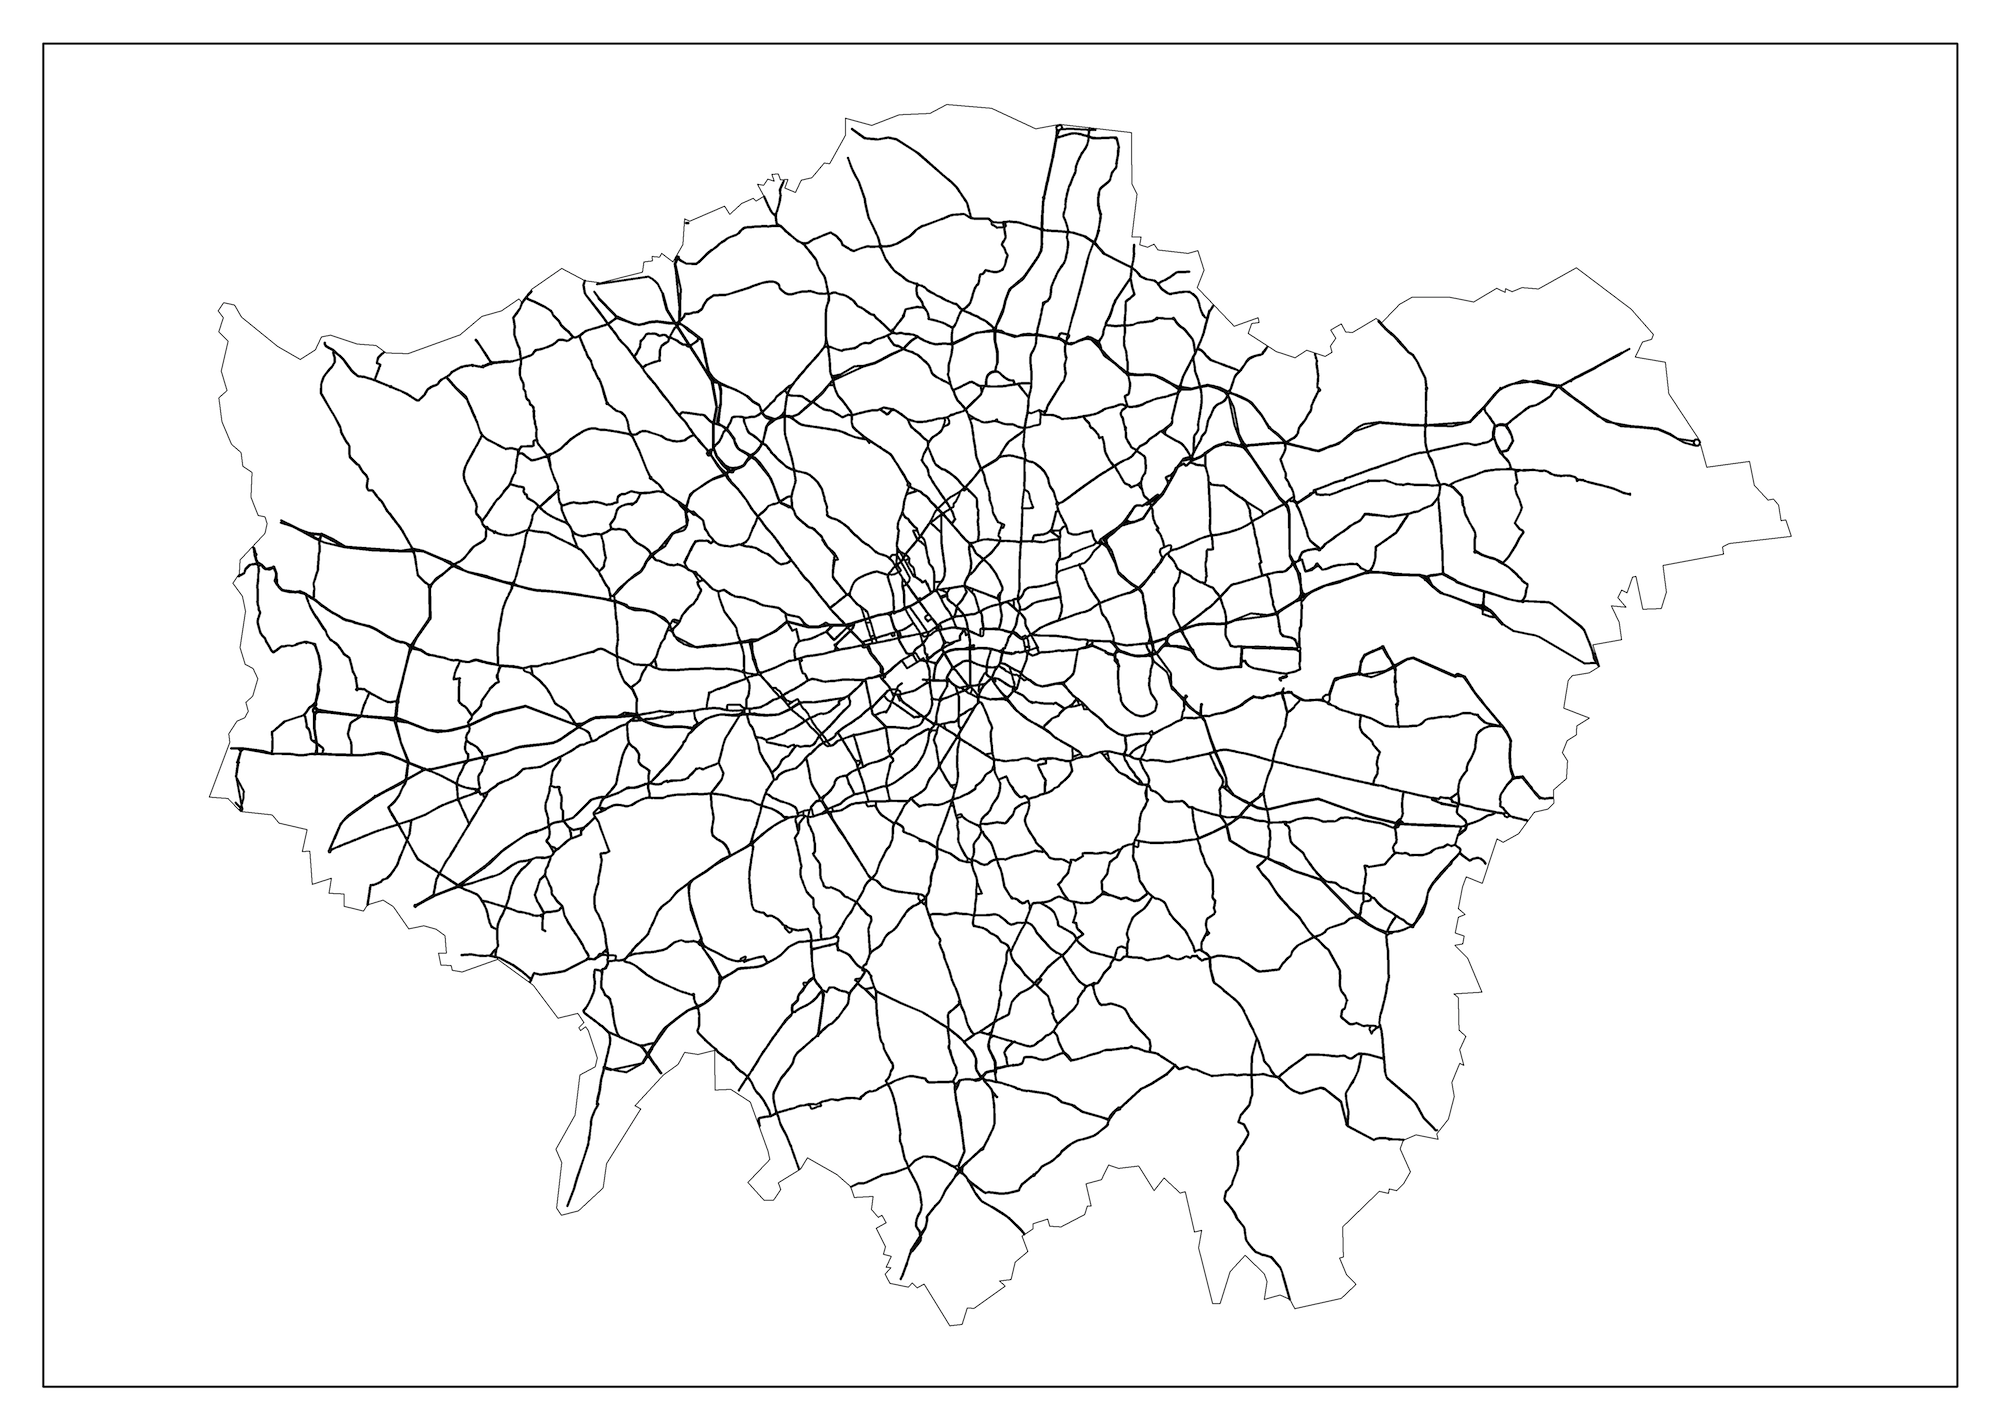
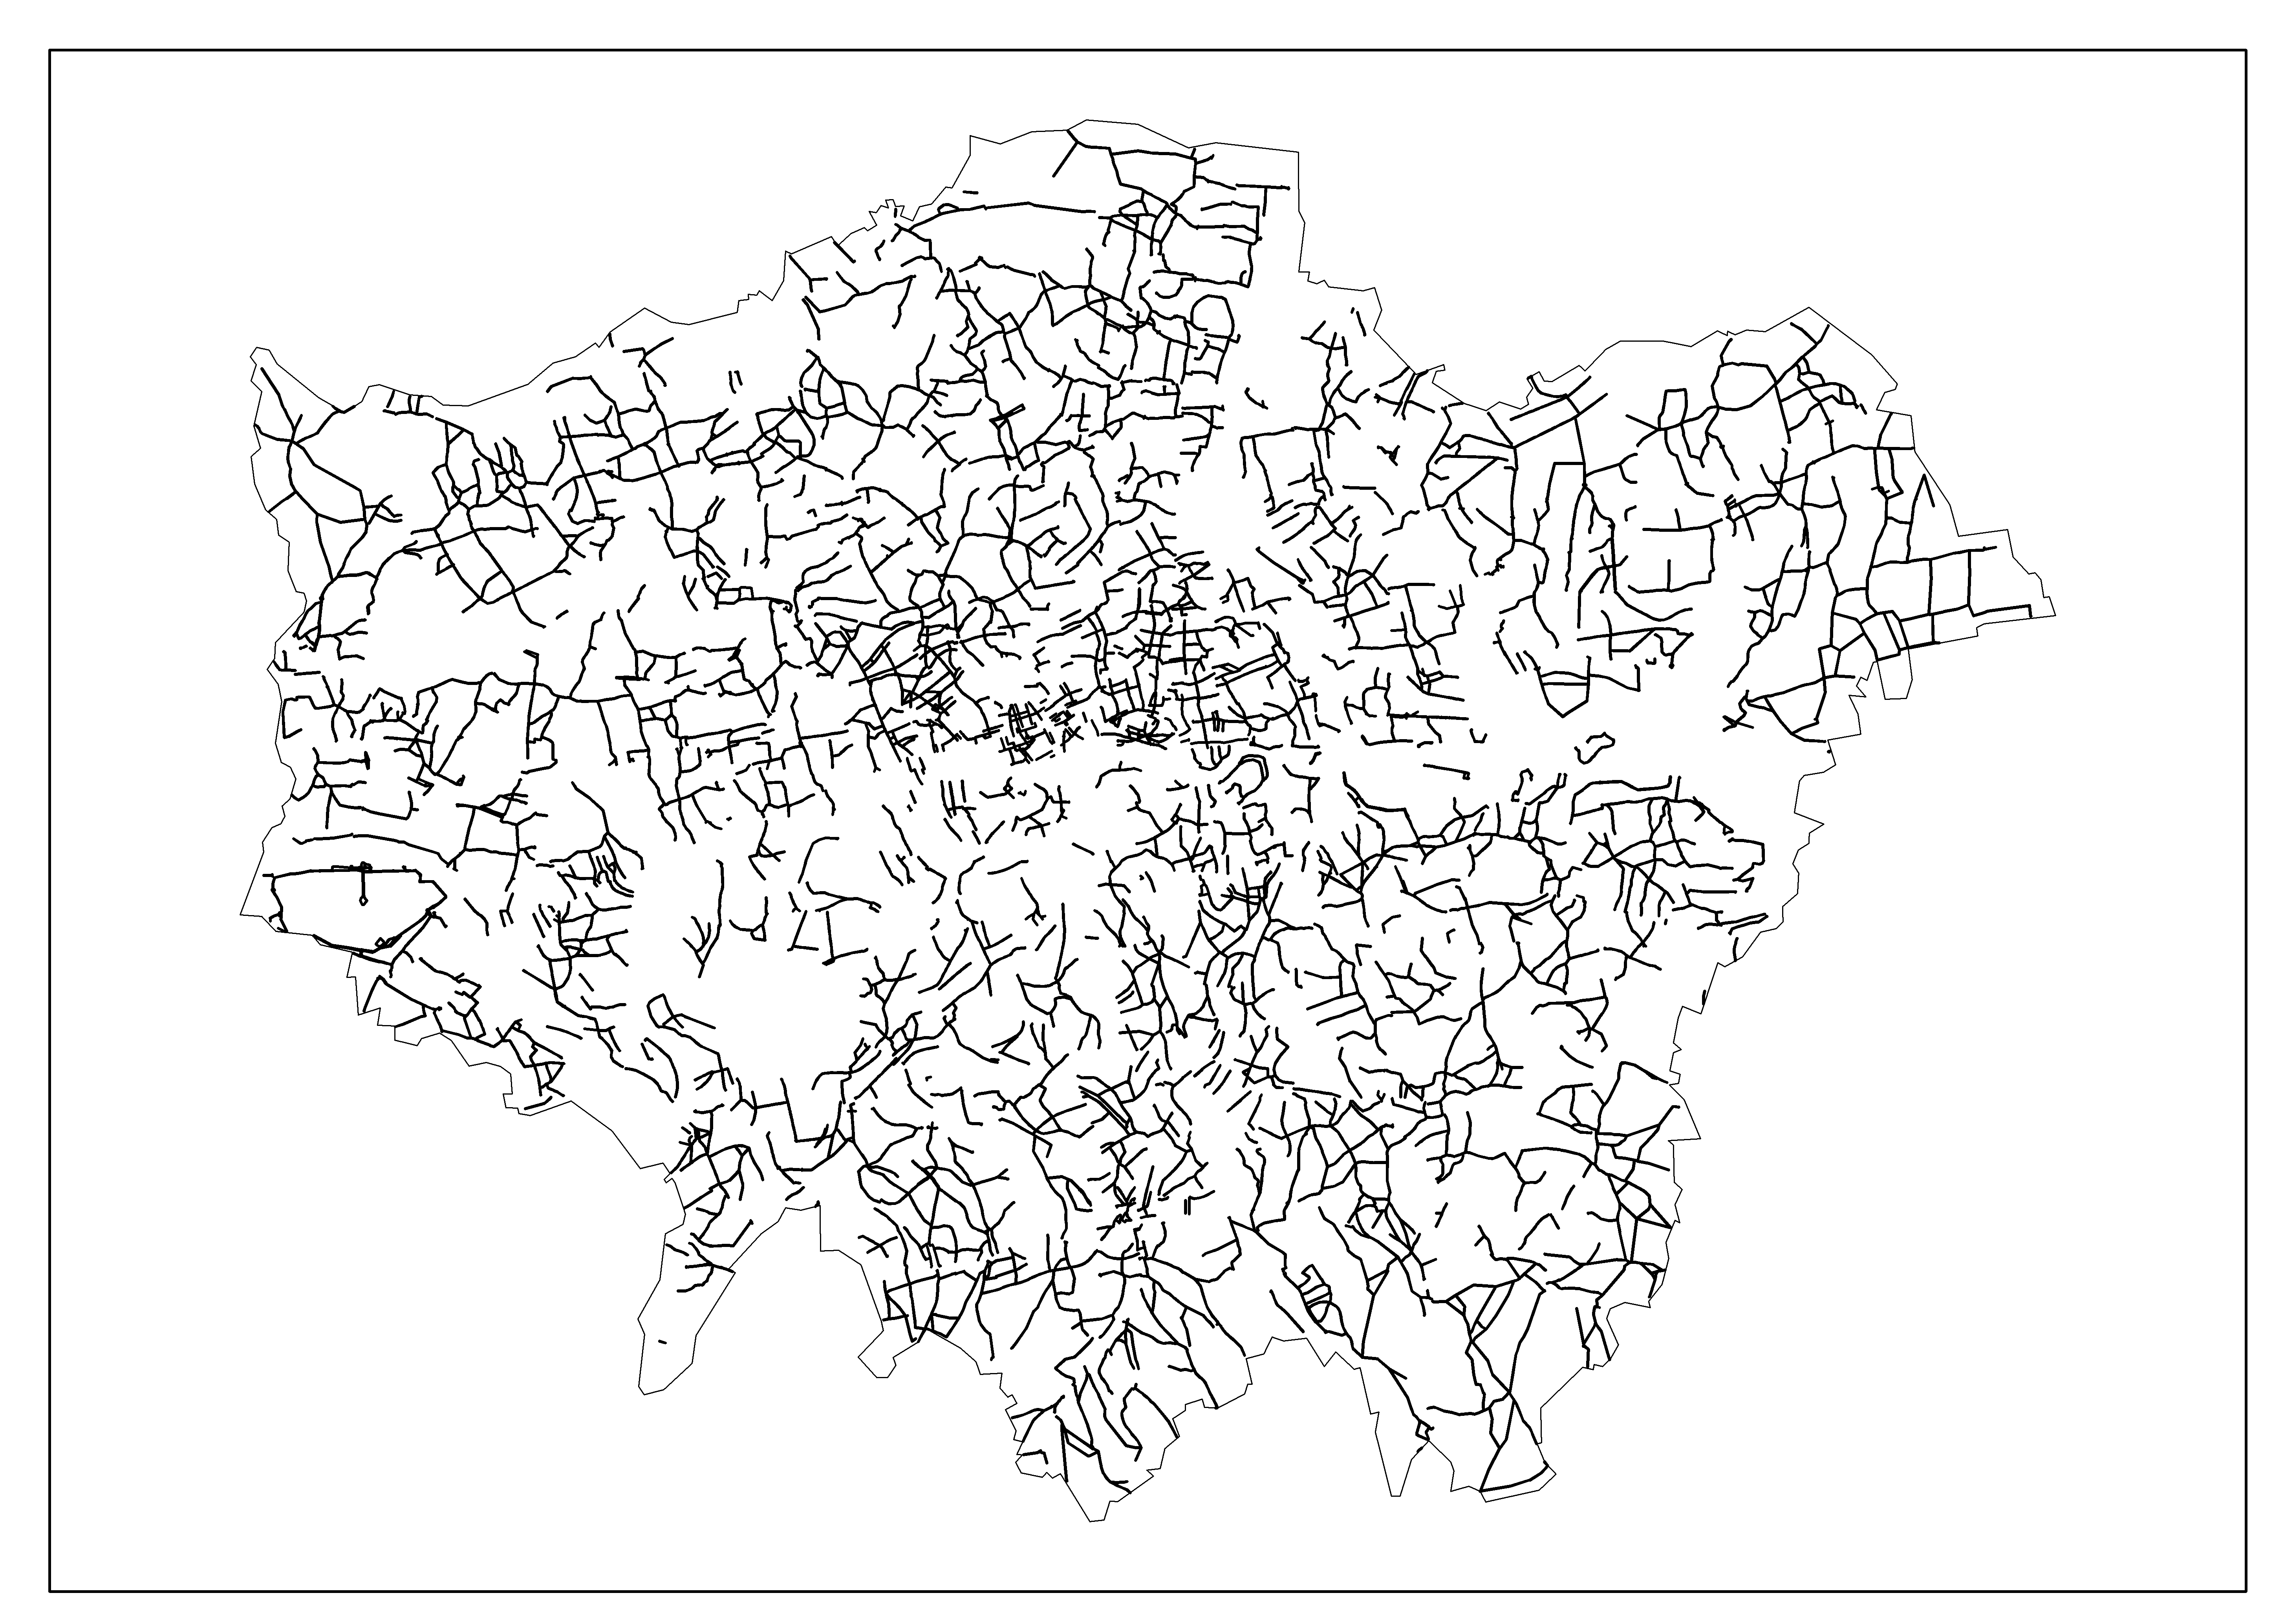
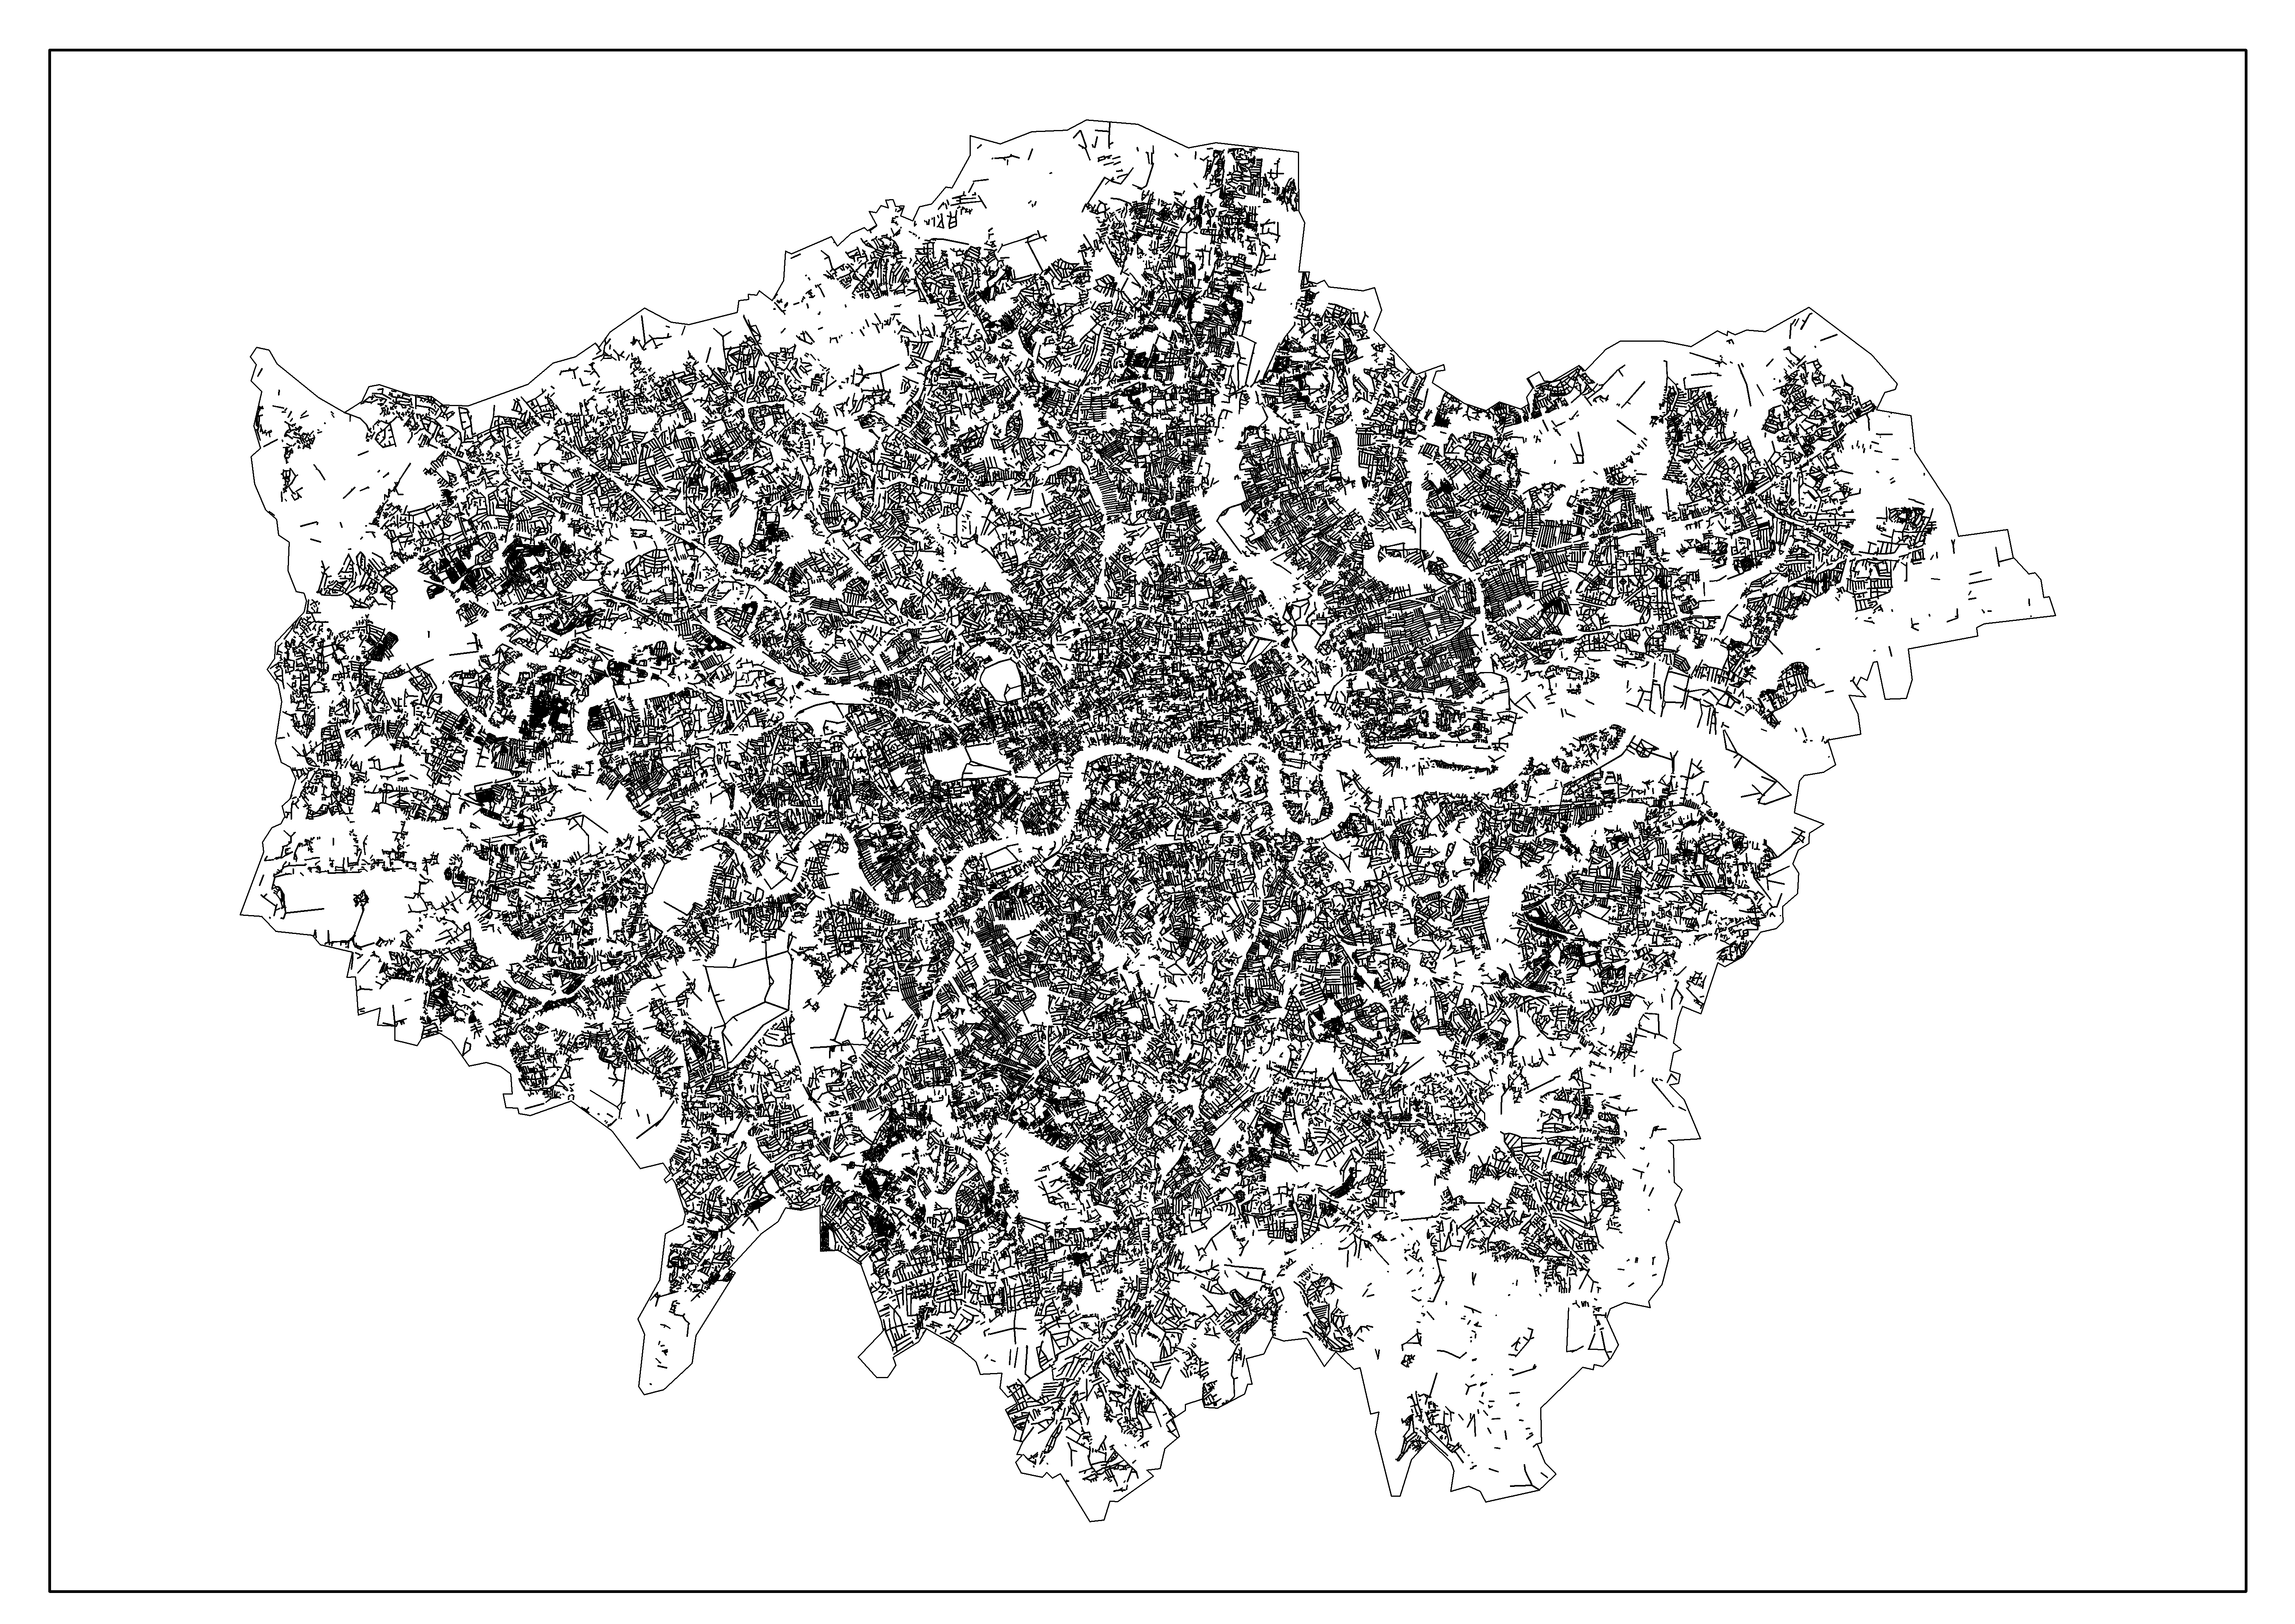
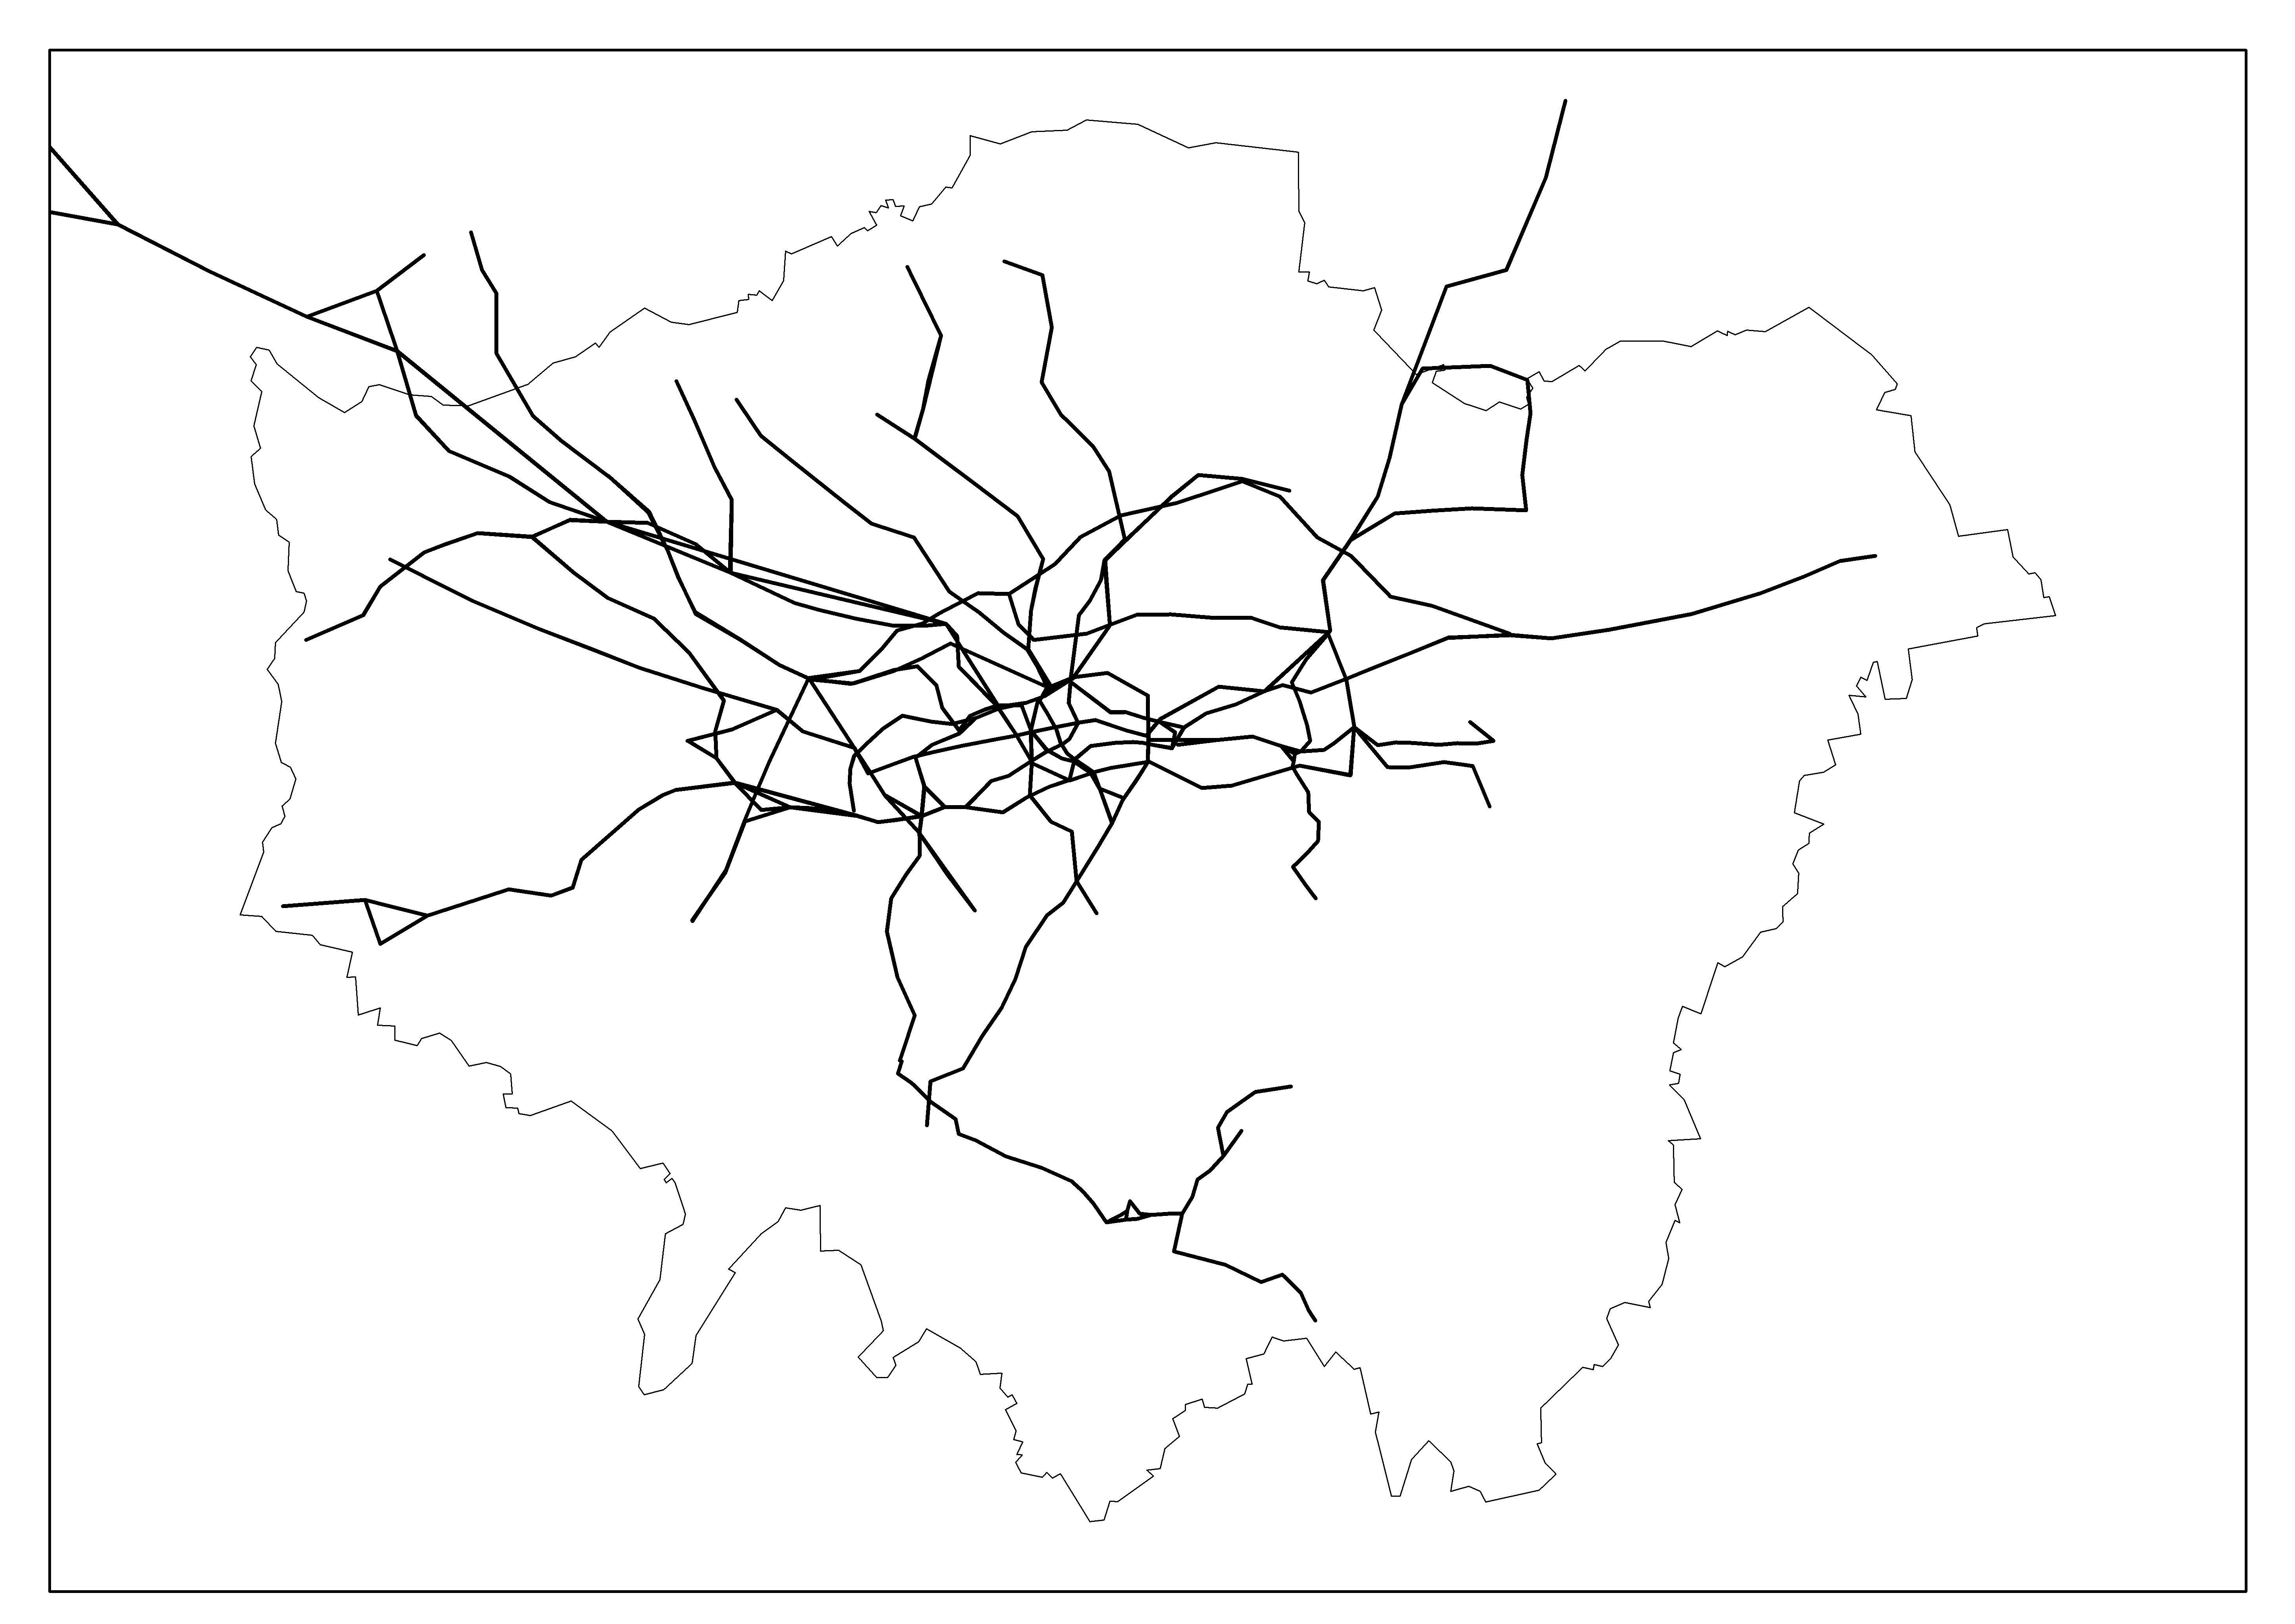 Figure 3.10: Hierarchical Transport Network Graphs in Greater London
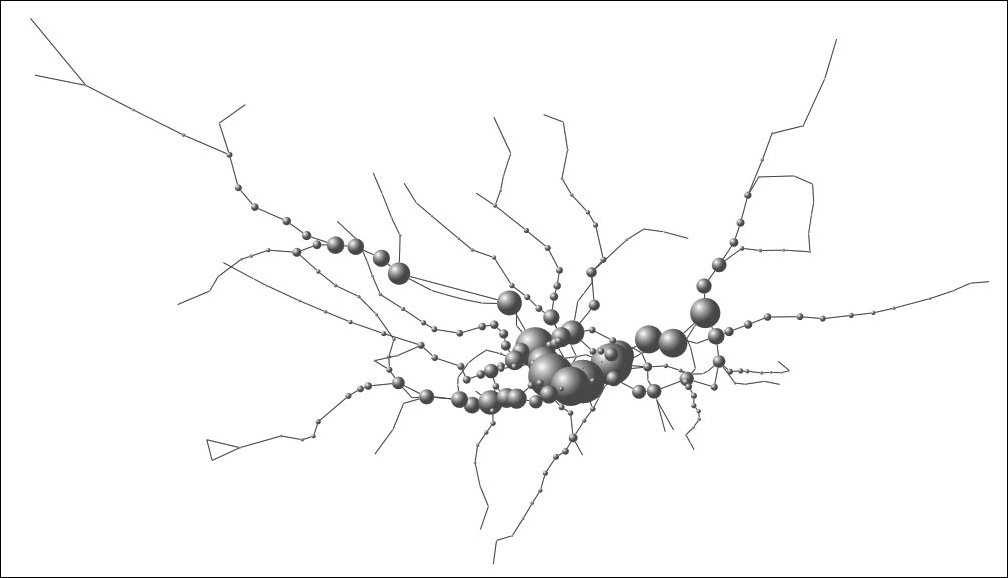 Figure 3.11: Betweenness Centrality at the Nodes Defining Stations on the London Tube Network
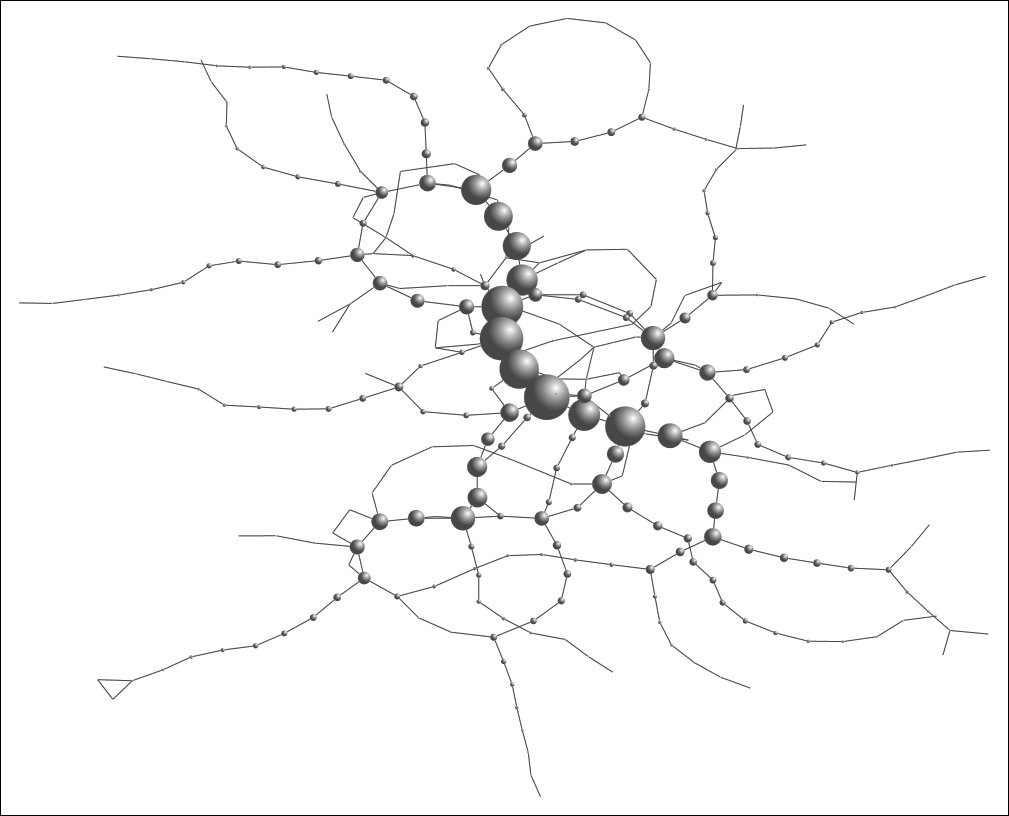 Figure 3.12: Betweenness Centrality for the London Network Presented Using the Harel-Koran Force Directed Algorithm (Anchored at Heathrow Airport, bottom left)

 Figure 3.13: Network Morphologies in a) Centralized and b) Decentralized Cities