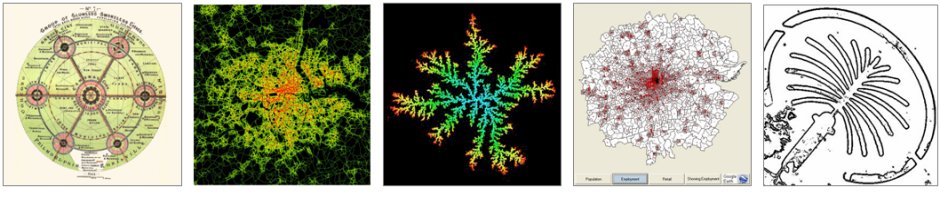
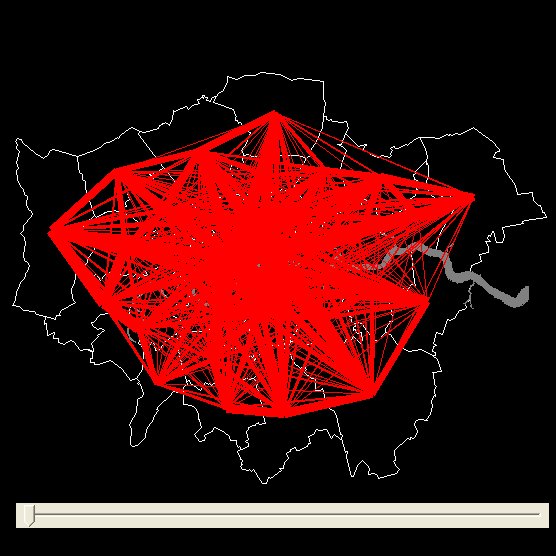
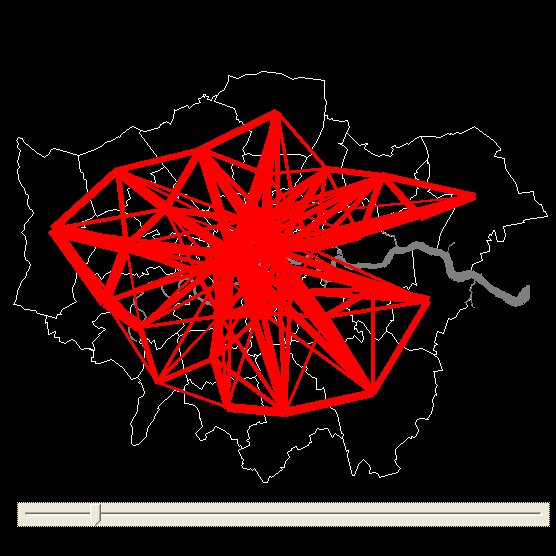
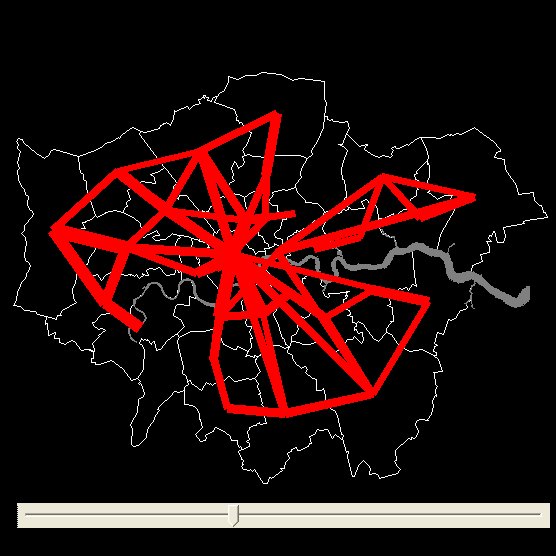
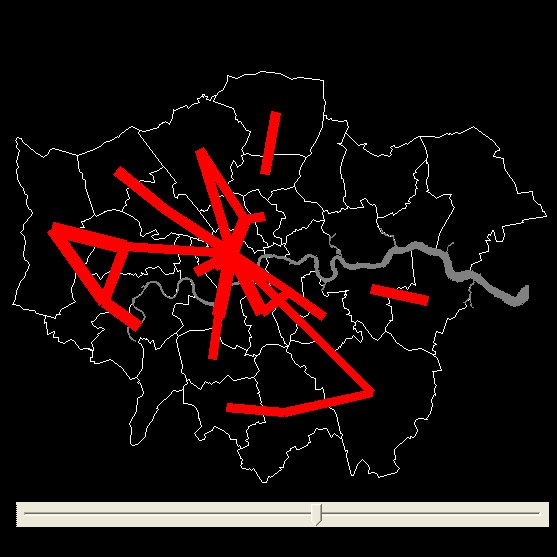
 Figure 2.1: Visualizing Aggregate Flows by Volume, from the Full 33×33 Matrix to the Largest Flows, with the Upper Middle Frame Set at the Flow Average
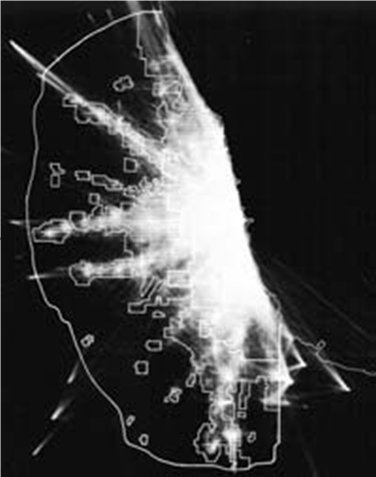 Figure 2.2: The Earliest Digital Visualization of Personal Trips on the 1959 Cartographatron Display Device
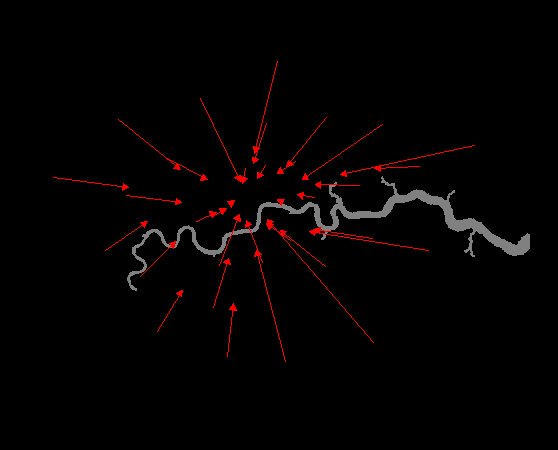
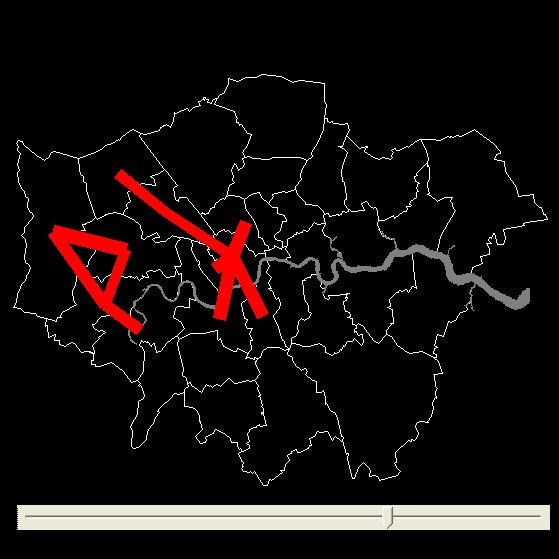
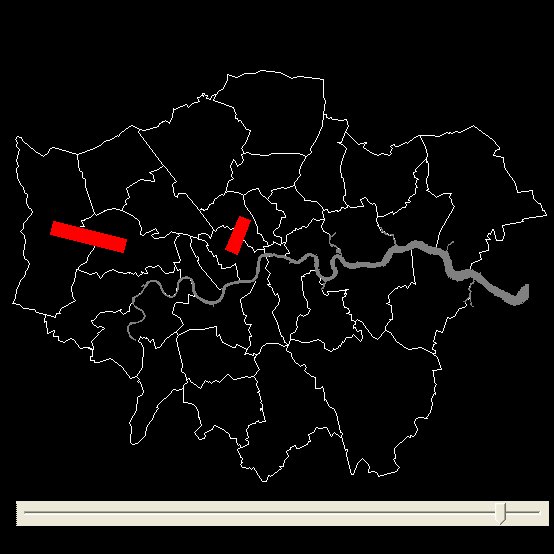
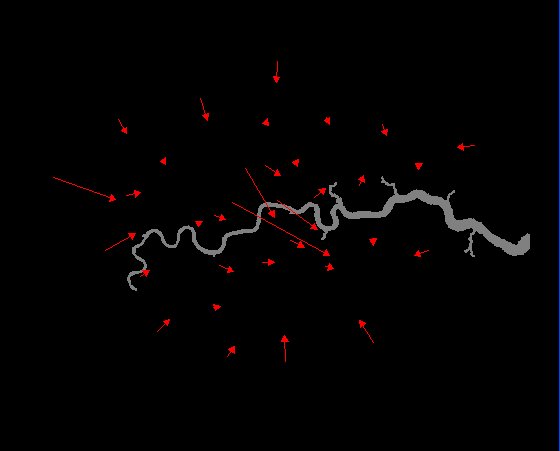 Figure 2.3: Directional Flows from (a) Origins to All Destinations and (b) Vice Versa
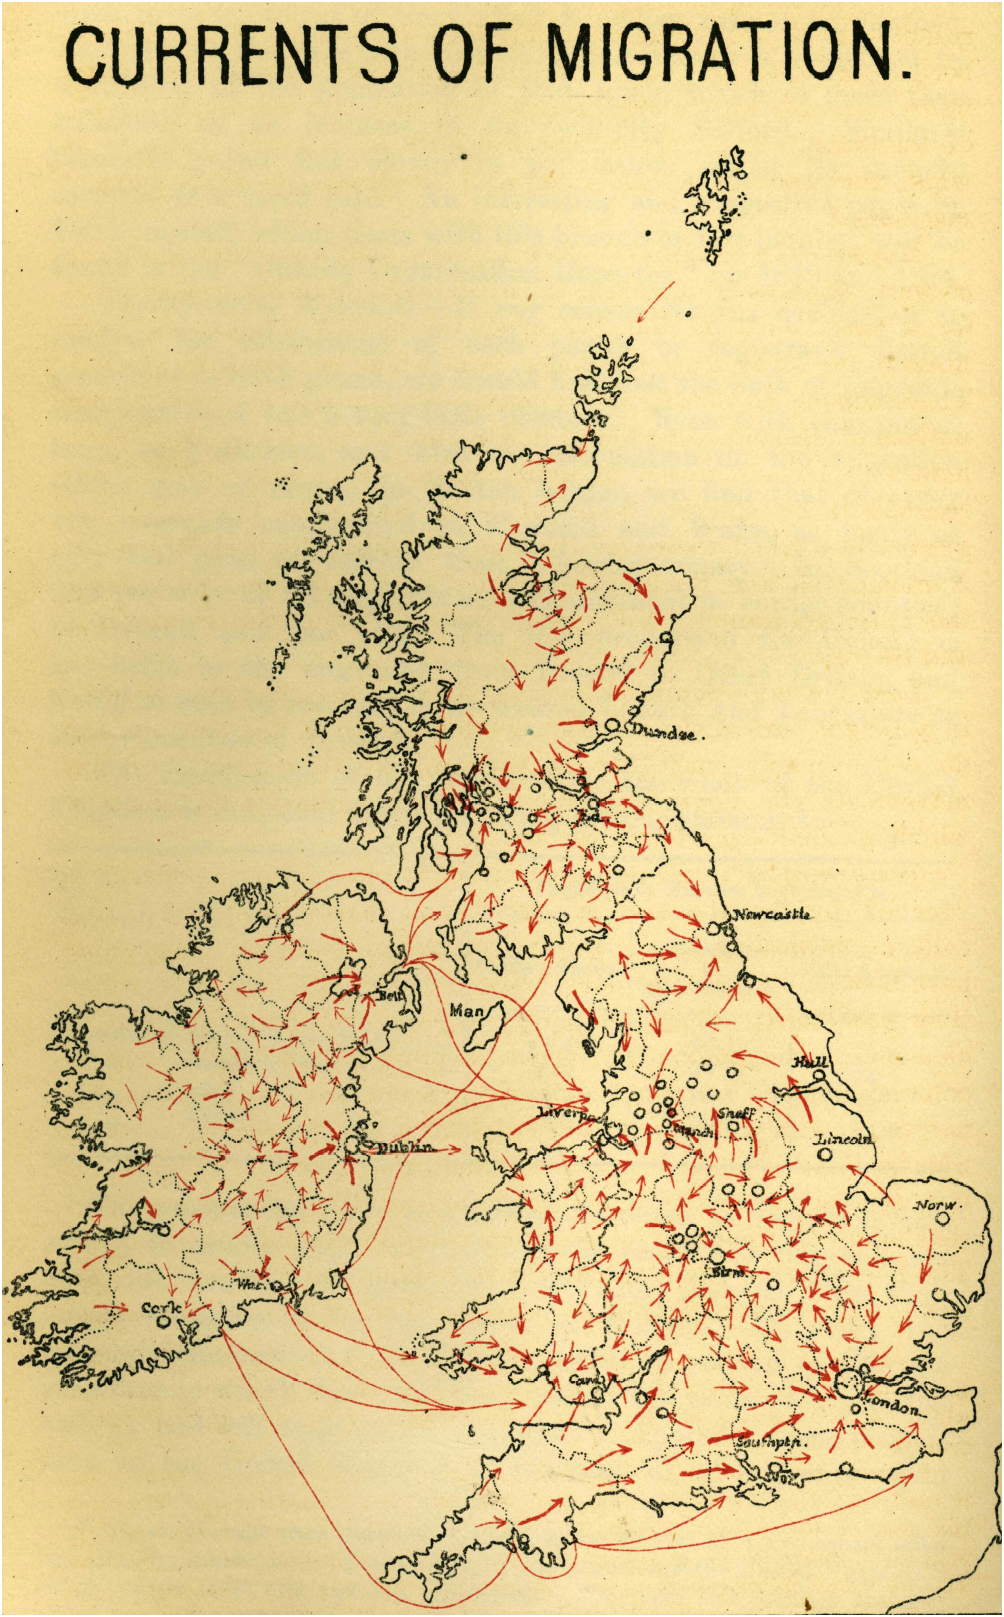 Figure 2.4: Ravenstein’s (1885) Currents of Migration
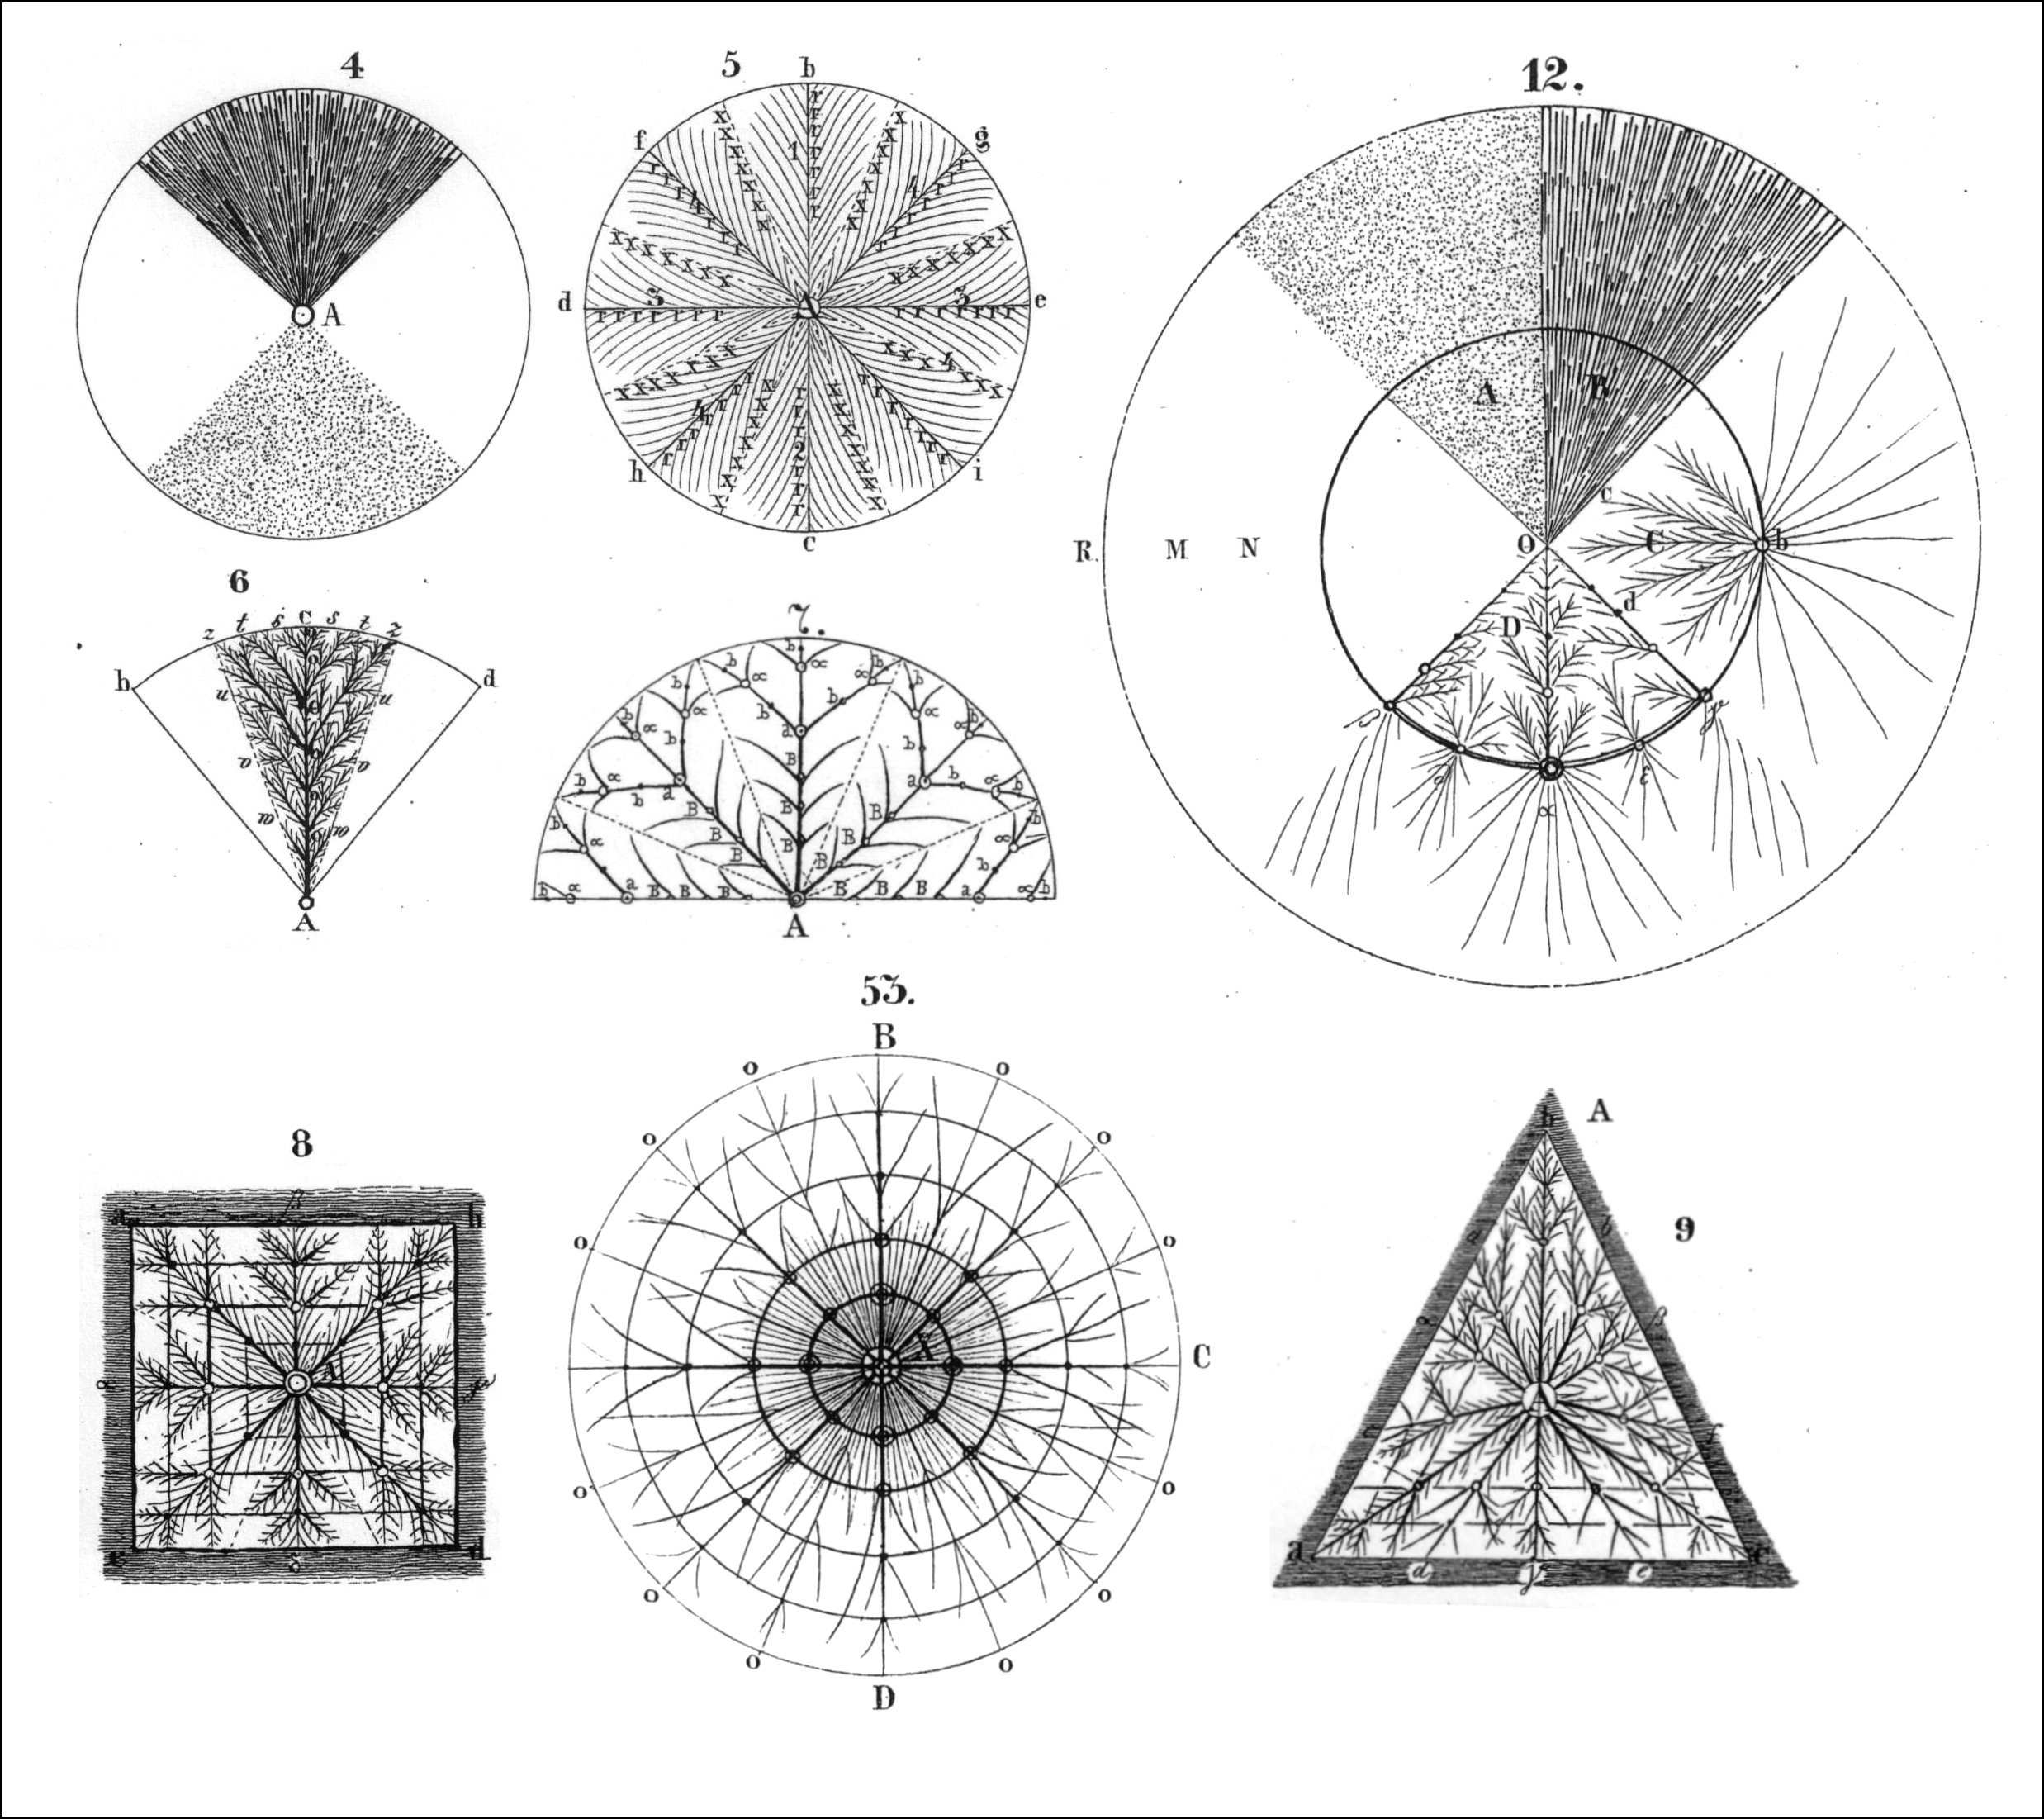 Figure 2.5: Kohn’s (1841) Flow Fields
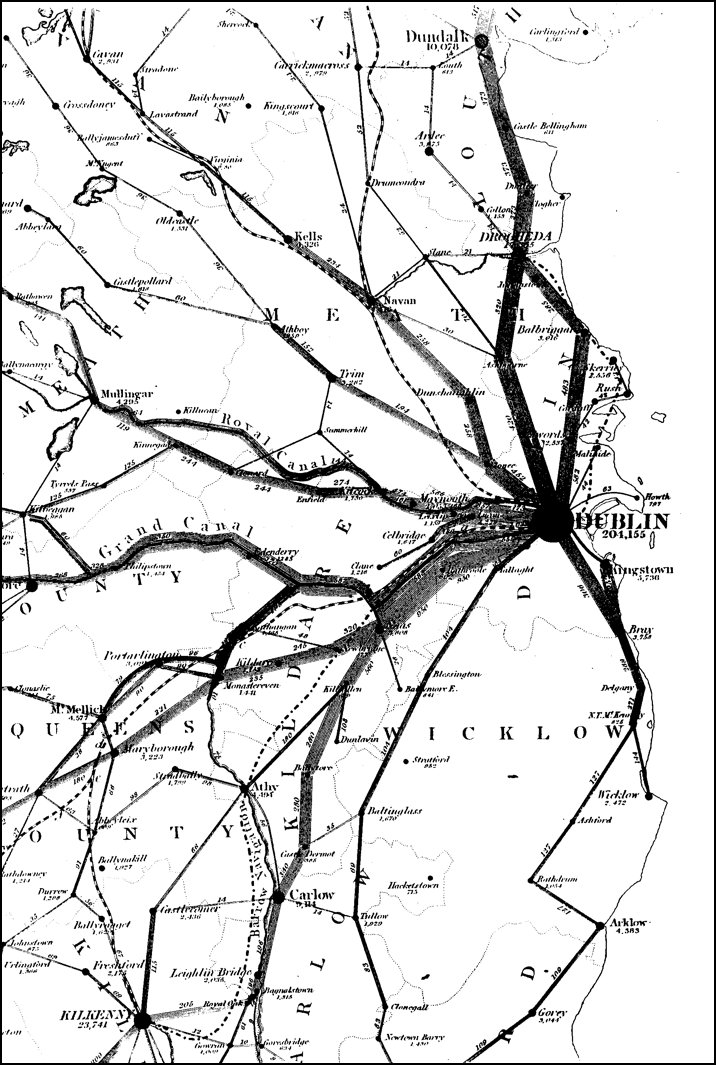
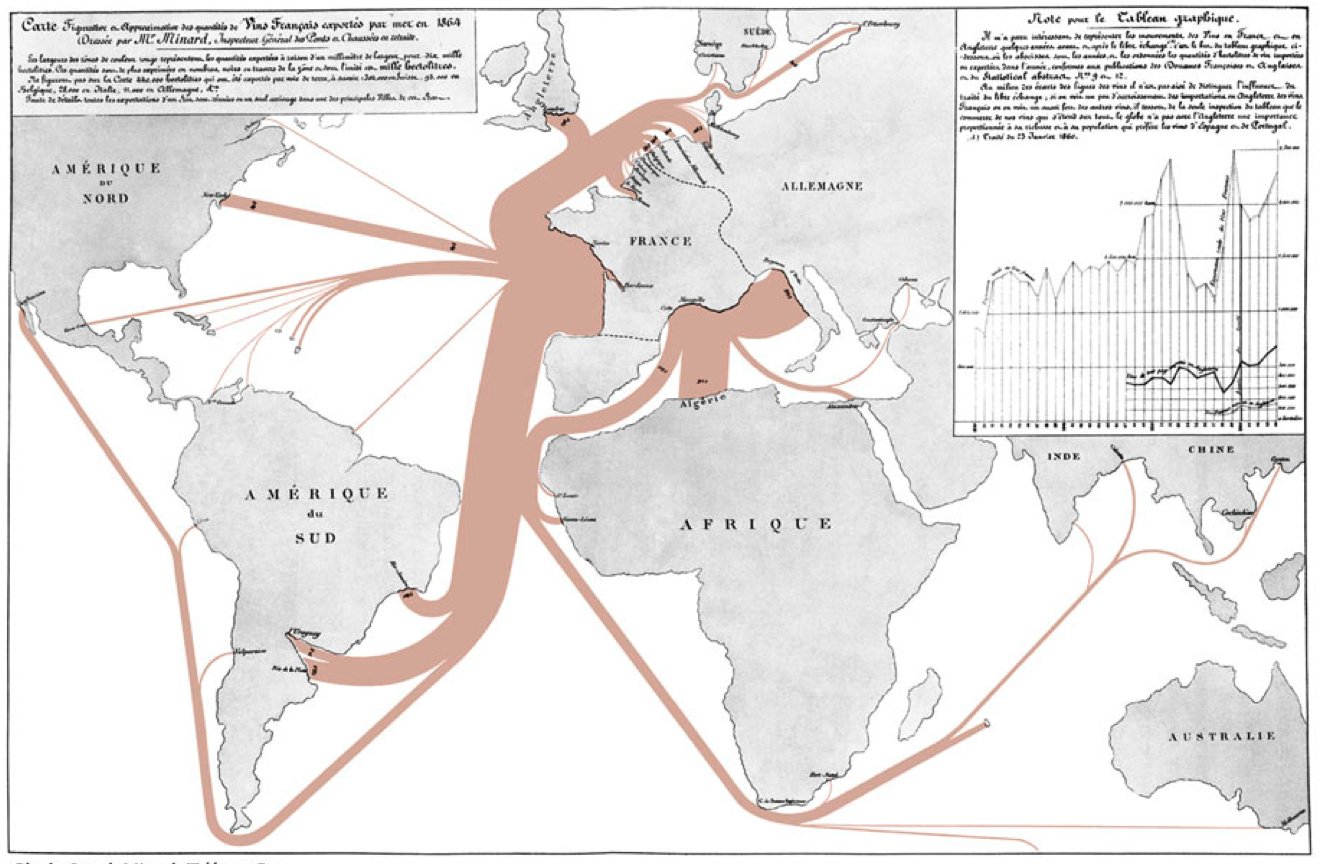
Figure 2.6: Flow Volumes Assigned to Explicit and Implicit Networks
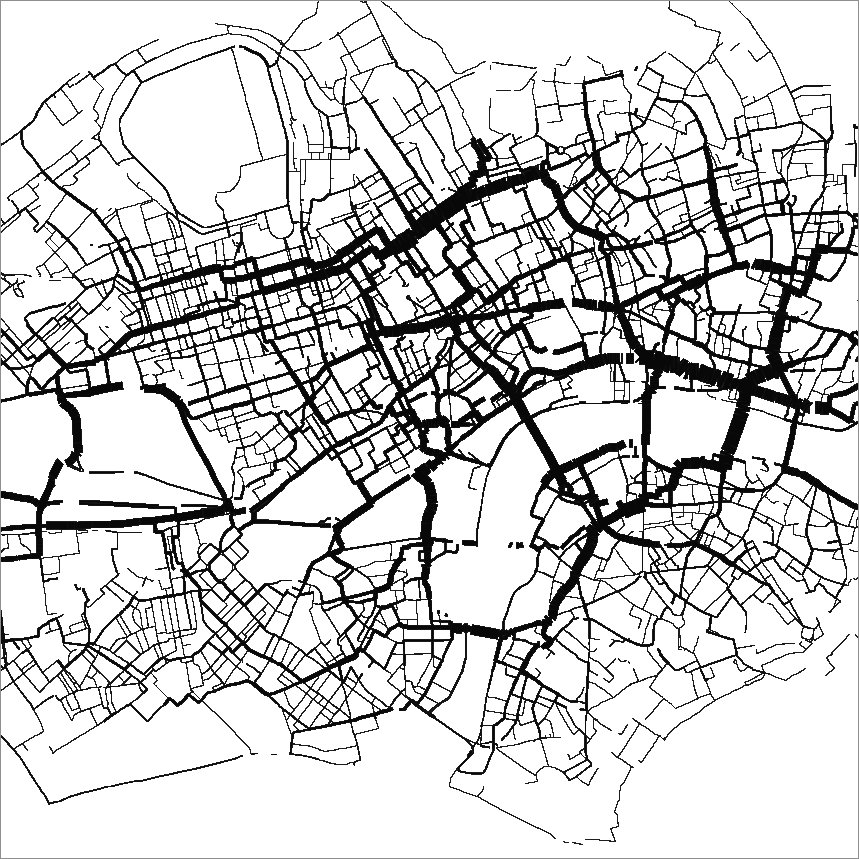
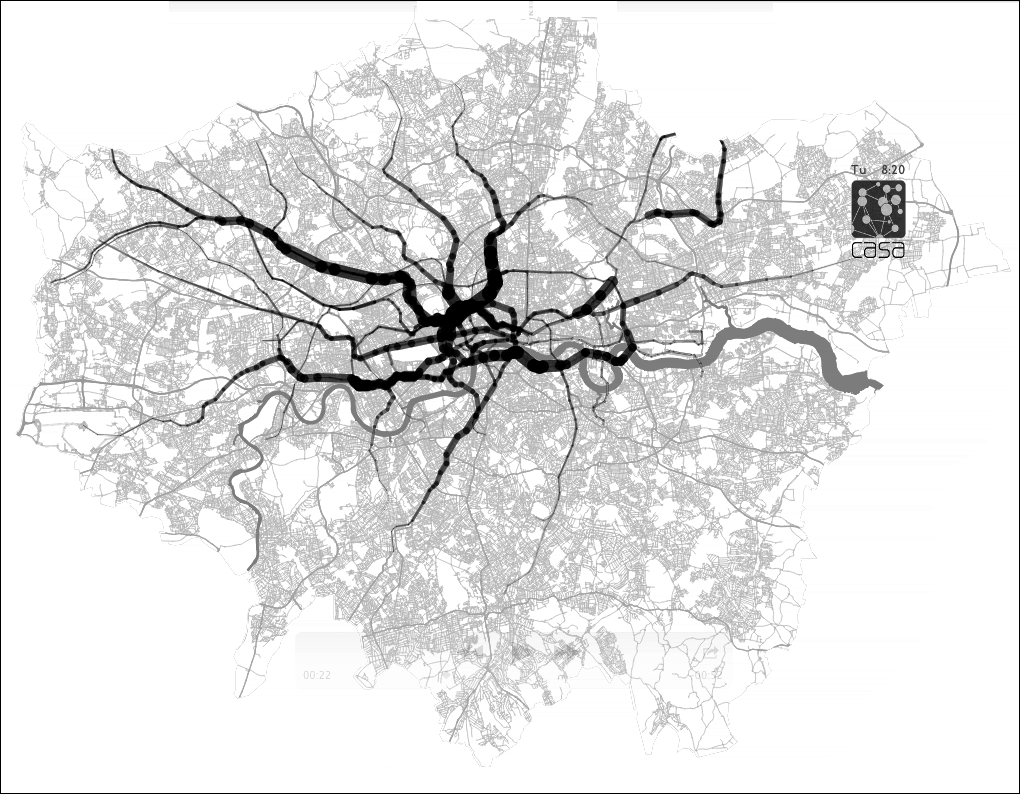
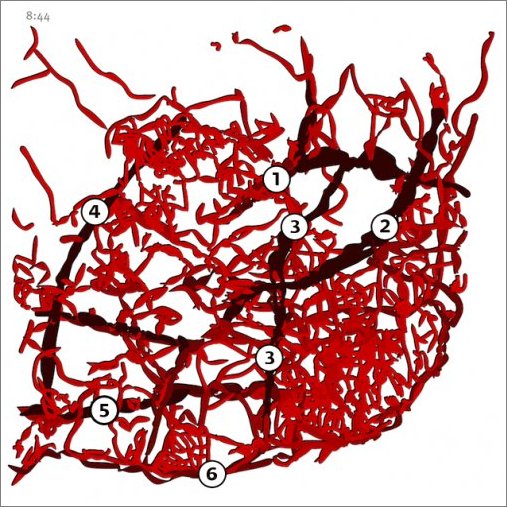
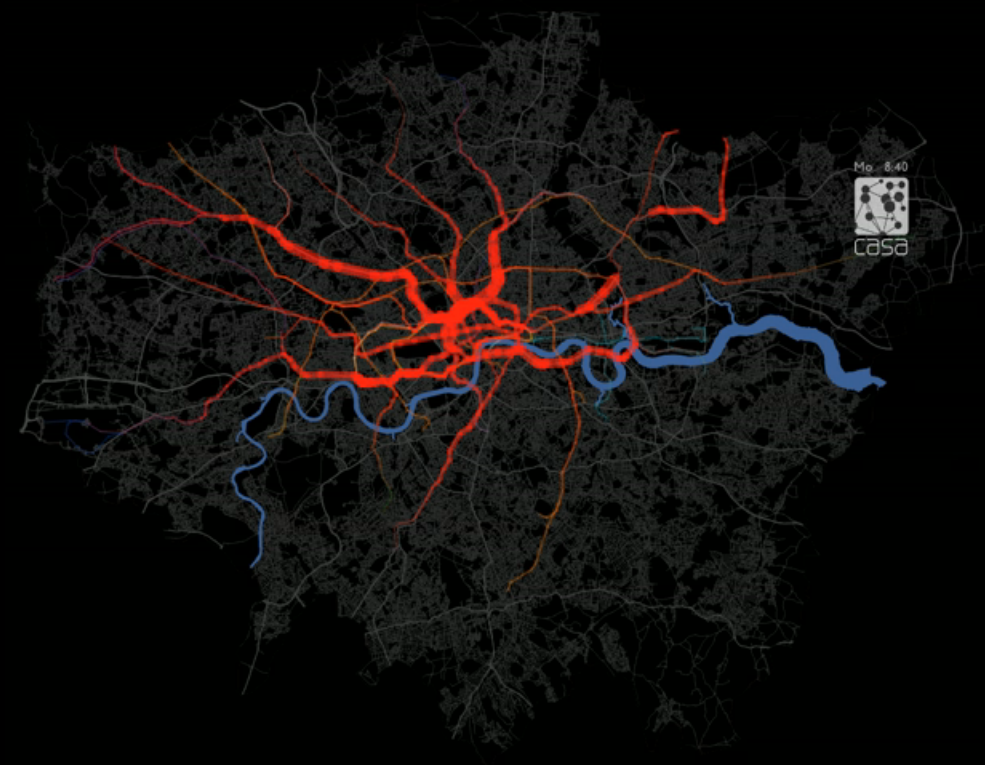 Figure 2.7: Assignments of Flow to Various Network Systems
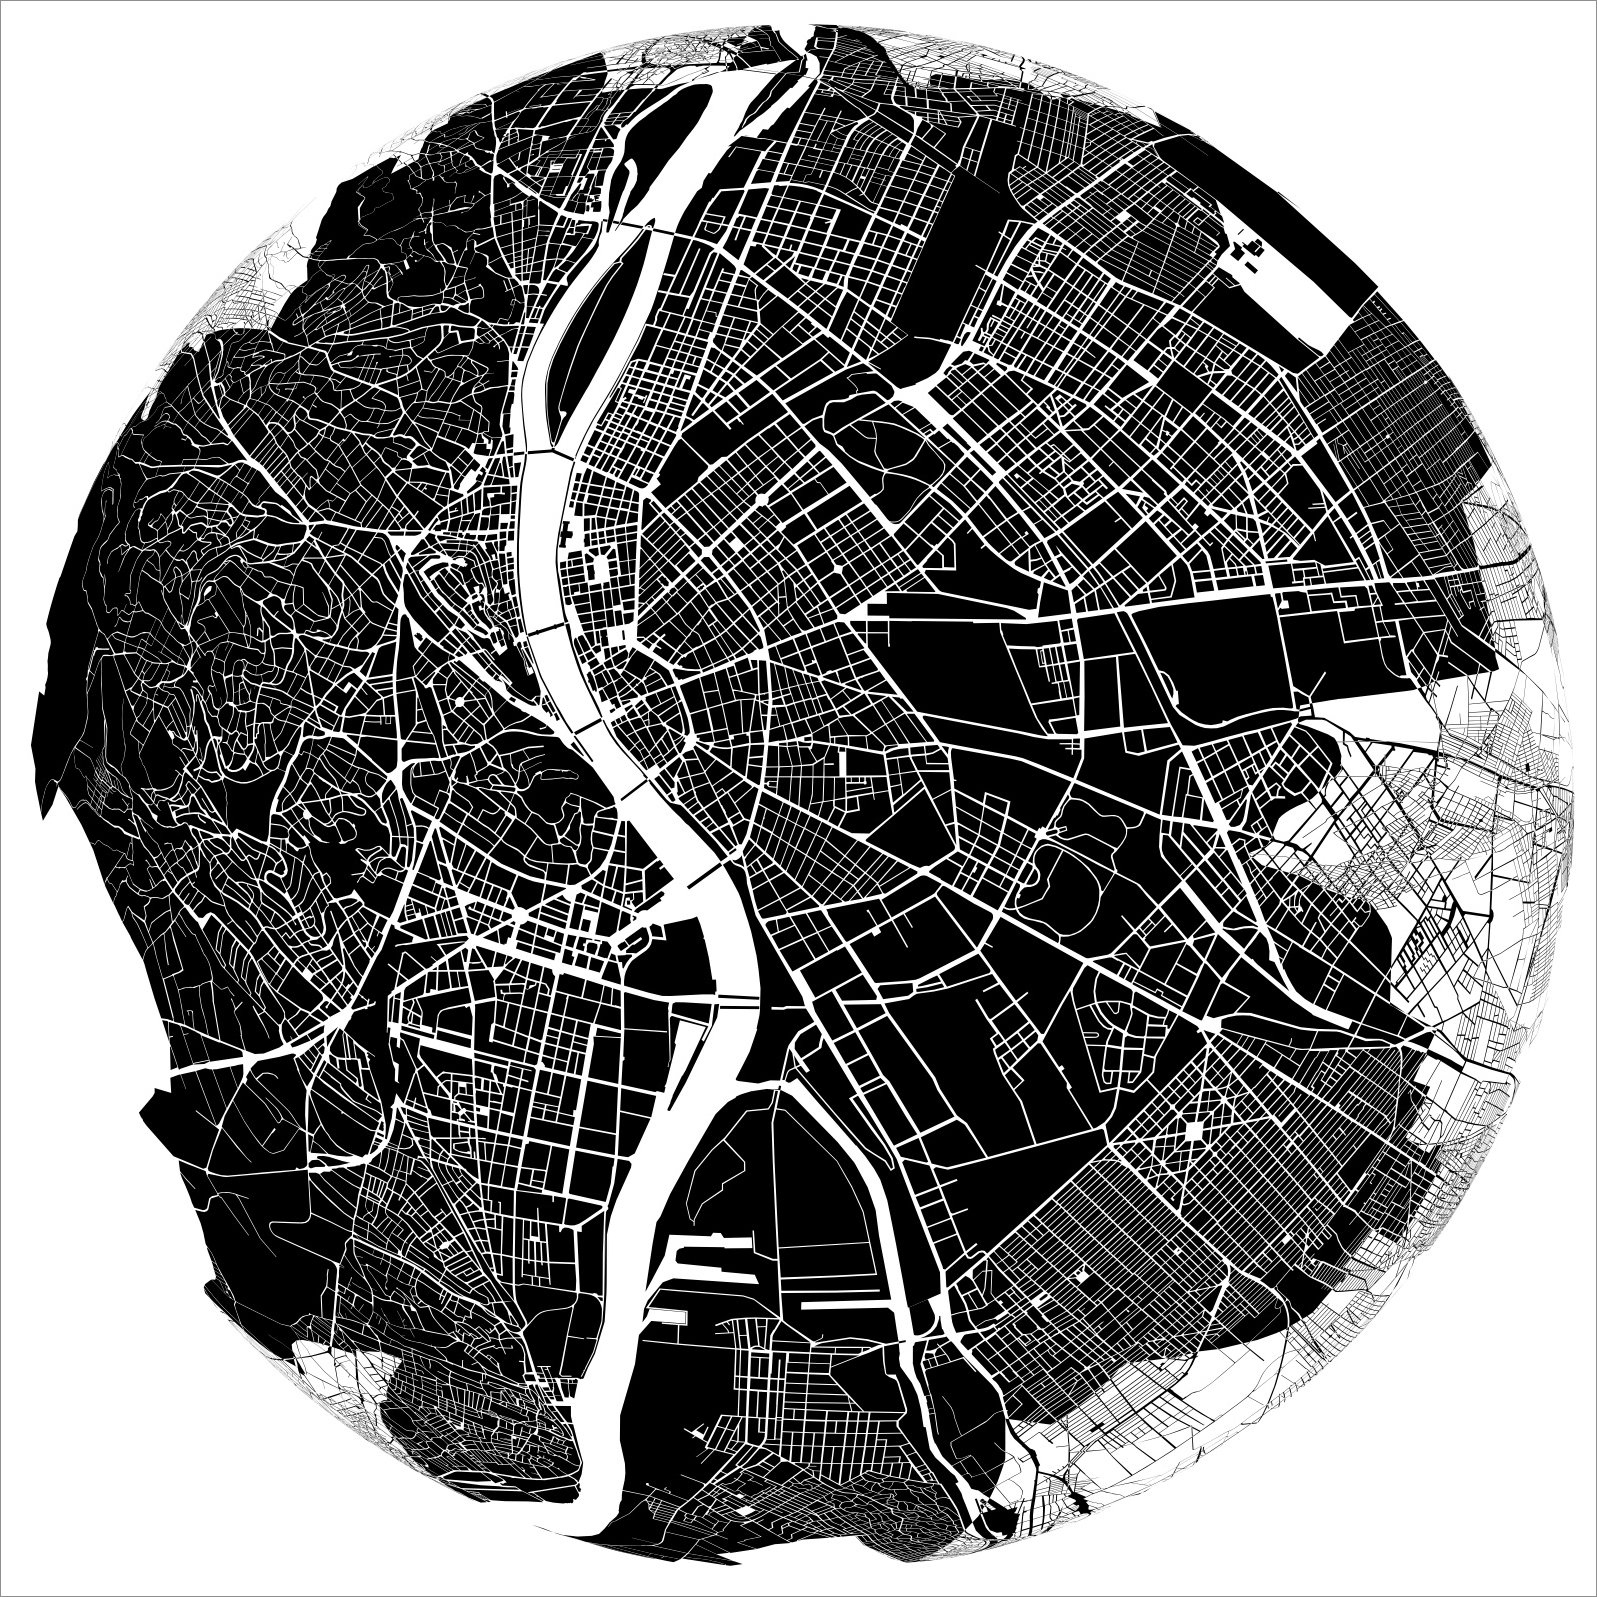
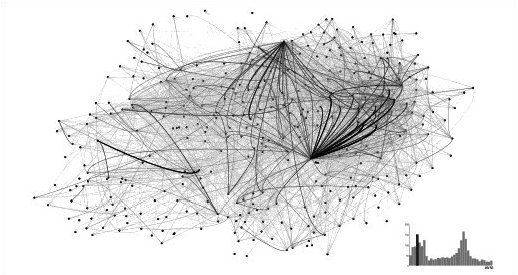
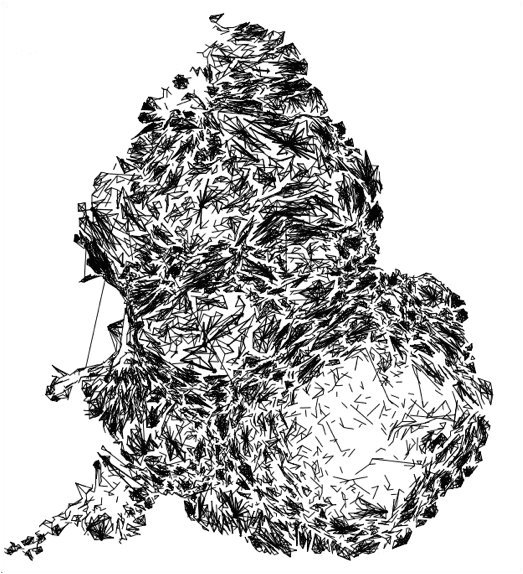
Figure 2.8: Distorting Flows in Various Network Systems
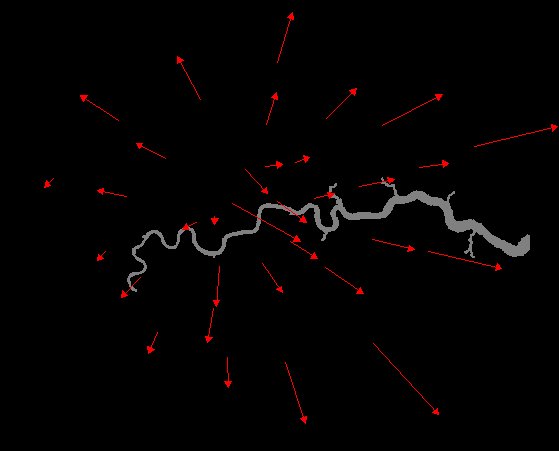
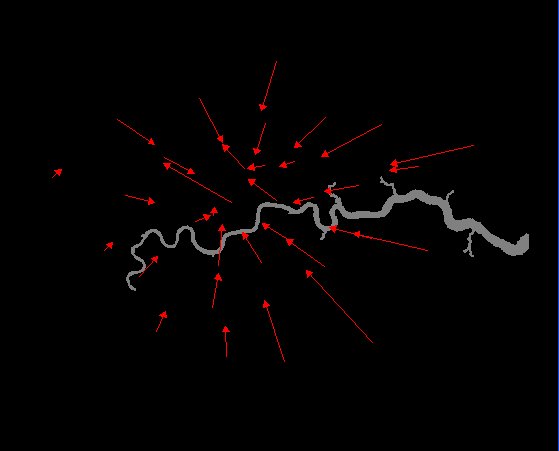
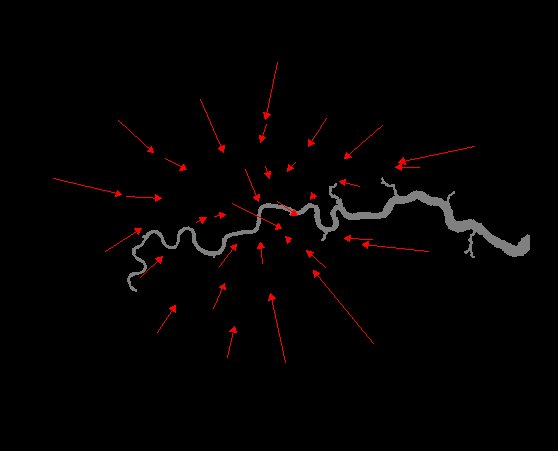
Figure 2.9: a) Directional Symmetric Flows, b) Asymmetric Flows from Origins and c) from Destinations